Quantcast
Channel: Housing, Wealth and Debt – Resolution Foundation
Viewing all 60 articles
Browse latest View live

The millennial bug: public attitudes on the living standards of different generations

$
0
0

As previous analysis for the Intergenerational Commission has highlighted, the principle of generation-on-generation progress that has come to define 20th Century Britain shows signs of being disrupted. In a range of areas, including their earnings levels, housing situation and the extent to which they are building up resources for later life, the living standards of younger adults appear under threat.

For those interested in pursuing policies to address these challenges a key question is the extent to which they are reflected in public perceptions. Drawing on a new quantitative survey of over 2,000 British adults and a qualitative workshop involving members of different generations, this is the question this report (prepared by Ipsos MORI for the Intergenerational Commission) seeks to answer.

For more on the Intergenerational Commission, visit the microsite here.

The post The millennial bug: public attitudes on the living standards of different generations appeared first on Resolution Foundation.


Home affront: the outlook for housing for young people across Britain

$
0
0

In recent decades, housing has gone from being a driver of falling wealth inequality to playing a central role in Britain’s living standards crisis. Across income groups and the generations we see widespread concern about the housing prospects of younger generations.

From the cost of housing to its size, quality and proximity to work, how has the state of housing in Britain affected living standards over recent decades? What can politicians do to address the worrying housing outlook for younger generations?

At an event at its London headquarters, the Resolution Foundation presented new analysis for its Intergenerational Commission of how people’s housing experiences have changed over recent decades, and what the future might hold in terms of home ownership. A panel of leading experts offered their take on how to tackle the housing crisis, before taking part in an audience Q&A.

The post Home affront: the outlook for housing for young people across Britain appeared first on Resolution Foundation.

Home Affront: housing across the generations

$
0
0

In this, our 9th report for the Intergenerational Commission, we take on the hugely important topic of housing. We compare the housing outcomes achieved by different generations over the life course and assess the extent to which intergenerational inequalities exist when it comes to security, to affordability and to quality. We explore how the housing experience of each generation has been determined by demographics, policy and the market alike, and what we might expect the future to hold.

The post Home Affront: housing across the generations appeared first on Resolution Foundation.

Politicians need to be talking about solutions to the housing crisis

$
0
0

Everyone’s worried about the young. Not least because, if June’s election is anything to go by, it turns out that they do in fact vote and aren’t exactly enamoured with what it turns out 21st Century Britain has to offer them. Whatever the reason for this summer’s youth-angsting, it’s a very sensible thing to do. It’s an even better thing to do if it leads to new ideas generated, taboos binned, and change delivered. Housing should be top of the agenda for those in the generating and delivering business, because the young might like their avocado toast but they’d prefer a decent home of their own.

Low home ownership rates are the poster child for the catastrophe that has been housing policy in Britain over the past half century. Today’s millennials are only half as likely to own at the age of 30 as the baby boomers were. Four times more of them are renting privately. Many of them not only grew up living in a home their parents owned, they grew up with the assumption that the same would be on offer to them before they had children of their own. They were wrong. The average age of a first time buyer today is 30, while the average age for having a first child is 29. That’s because house price surges have meant it now takes 19 years for a typical earner to save for a deposit, compared to 3 years in the 1980s. There’s been no similar increase in the time taken to produce a child. For all the nonsense about millennials being flighty, when it comes to the security of home ownership they’d rather be a lot less footloose and fancy free.

Unfortunately it turns out that our housing disaster isn’t limited to frustrated home ownership. It’s also cost all of us a lot of money. In the 1960s we spent 6 per cent of our income on housing. Today that figure is 18 per cent, a tripling of the share of our income that goes on housing that has acted as a drag on the living standards of all of us – baby boomers included. And those figures are averages. Looking at specific generations makes the growing pressure of housing costs even starker. The silent generation (born largely pre-war) saw housing costs of a little below 10 per cent of their income during their thirties. That had risen to almost 20 per cent for the post-war baby boomers. More recent generations are paying an average of over 20 per cent of their income on housing. So it’s not just the millennials that have lost out badly – we just put up with it while people were seeing big wealth gains in exchange for rising housing cost. Now the young have realised they’ve inherited the certainty of those sky high housing costs in exchange for the possibility of inheriting some of that wealth, probably long after its much use to them. Understandably they don’t think that’s a great deal.

And while the prospect of inheritance in the distant future may reassure some, many more are making very real compromises in the here and now – living in smaller properties, further from where they work. Average floor space has fallen by 4 per cent since 1996 for people aged under 45, while it has increased by 2 per cent for those aged 45 and over.  More starkly, millennials look set to spend an extra 64 hours a year commuting to work by the age of 40 compared to baby boomers. They’d understandably like their two and a half days back.

It’s very good news that all parties are focused on the young as we head into conference season. If they want to really make a difference they should spend those conferences talking about our housing disaster and what they are going to do about it. This generation of politicians didn’t cause our housing crisis, but this generation of voters won’t forgive them if they don’t start sorting it out.

This article was originally published on Times Red Box

The post Politicians need to be talking about solutions to the housing crisis appeared first on Resolution Foundation.

Britain’s housing catastrophe has driven a 50-year drain on living standards

$
0
0

The average share of income that Britain’s families spend on housing has trebled over the last 50 years, with young people having to make do with longer commutes and smaller, insecure rented accommodation, according to a new report published today (Wednesday) by the Resolution Foundation.

As Labour and the Conservatives head to their party conferences looking to learn the lessons from the shock election result in June and the highest turnout amongst young people since 1992, the report starkly illustrates why the question of generational fairness and housing has become a totemic concern about living standards in Britain today.

Home Affront shows that each generation since the war has had to spend more of their income on housing.

The pre-war ‘silent generation’ (1926-1945) spent just 7 per cent of their income on housing at the age of 30. This figure more than doubled for the baby boomers (1946-1965), who spent 17 per cent of their income on housing at that age. And it has reached a record high for millennials today (1981-2000) who currently spend almost a quarter of their income on housing (23 per cent) at age 30.

While housing costs have escalated, the baby boomer generation has been the biggest beneficiaries of improvements in the security and quality of housing that have taken place over this time as home ownership spread.

Those born in the late 1940s have enjoyed the highest ownership rates over the course of their lives, with each five-year cohort after them doing worse than their predecessors. Home ownership rates among young families born in the early 1980s are now around half that of those born 30 years earlier at the same age.

The Foundation notes that while housing has been a growing drag on living standards for everyone, increased home ownership has boosted the wealth of older generations, as well as their income in later life as a record proportion now own their homes outright.

In contrast, younger generations are being rewarded for the record amount they have to spend on housing with lower home ownership, greater insecurity and smaller homes that are further from where they work.

The report shows that there are now as many young families (aged 25-34) living in the private rented sector (PRS) as owning a home or living in the social rented sector combined (36 per cent).

It also finds that average floor space has fallen by 4 per cent since 1996 years for people aged under 45, while it has increased by 2 per cent for those aged 45 and over. Young people today are also compromising on location, with millennials set to spend an extra 64 hours a year commuting to work by the age of 40 compared to baby boomers.

Home Affront warns that while the passing of the financial crisis means some young households will be able to become home owners, the outlook for younger generations is on course to continue deteriorating.

Even in an optimistic scenario in which home ownership for young people ‘catches up’ with the generation before them, the age at which most families will own their own home could be delayed until their 40s – a decade later than when most baby boomers got onto the housing ladder.

Such a delay would mean many more first-time parents living in private rented accommodation, where 2-month eviction notice periods are the norm, and facing the daunting prospect of having to save for a deposit while facing childcare costs.

The Foundation is calling on all political parties to make addressing Britain’s housing crisis a central feature of their domestic policy agenda as it is a big part of the answer to ensuring that each generation continues to do better than the one before them. Bold policy action should include boosting housing supply and reforming the PRS so that it offers the quality and security that families need.

Lindsay Judge, Senior Policy Analyst at the Resolution Foundation, said:

“The shock election results of the last 15 months have shown that significant discontent exists about the direction that Britain is heading and housing is huge a part of this anxiety. Across the generations, many are worried about why today’s young adults have it so hard when finding a secure place to live.

“Britain’s housing catastrophe has been 50 years in the making but while its effects are widespread it is millennials who are truly at the sharp end. For older generations at least rising housing costs have been accompanied by improvements in the quality and security of housing, as more families have been able to own their home.

“The big danger today is that young people are having to settle for lower quality, longer commutes and less security in order to afford a place to live, despite spending a record share of their income of housing.

“It is vital that all political leaders recognise the scale of Britain’s housing crisis which is placing an ever greater strain on families’ living standards, so that their response is suitably radical.”


The post Britain’s housing catastrophe has driven a 50-year drain on living standards appeared first on Resolution Foundation.

Social housing for the younger generations?

$
0
0

Social housing has received much well-deserved attention over the conference season and even looks set to be the star of the show in Theresa May’s speech. But while the rise and fall of the sector is a familiar story, the intergenerational consequences of its course are rarely remarked upon. With our new research showing that so many of today’s young people are adrift when it comes to housing, it’s worth thinking about how their parents and grandparents benefited from the post-war social housing project – and whether a similar offer is really going to be made today.

In 1981 – the sector’s highpoint – three out of every ten families rented their home from the council or a housing association; today, that figure has halved. And there’s a very simple explanation as to why this is the case: as Figure 1 shows, years of low build rates and Right to Buy sales mean there’s simply less social housing stock to go round.

Figure 1: Net additions to social housing stock over time: England

Source: RF analysis of DCLG live tables data on housing completions (Table 209) and Right to Buy sales (Table 678)

Combine this with the fact that those offered social tenancies are often reluctant to give up this prize and it’s easy to see how the number of social rent properties available to young people has fallen over time. In Figure 2, the intergenerational effect of this is plain to see. Look first at the experience of those born before the war and we see how families from these generations benefited from the expansion of the sector in its prime. Compare, then, the rates at which younger generations have occupied this most affordable of tenures and the impact of the sector’s decline is evident. Add in the fact that social renting rates for older generations fell after 1980 and we can see that for them social housing was a gift twice over: first, in providing a secure and affordable home and second, in giving them the chance to purchase their property after the Housing Act 1980 introduced Right to Buy.

Figure 2: Proportion of families living in the social rented sector over time: UK

Source: RF analysis of Family Expenditure Survey 1961-1983; Labour Force Survey 1984-2017

Not only have older generations been able to access social housing in greater numbers than their younger counterparts but their qualitative experience of the sector has arguably been better as well. In the early years of the sector’s development social builds were often at the cutting edge of quality and design. With standards slipping from the 1970s onwards, and many of the more pleasant properites sold off under Right to Buy, social housing is too often a watchword for poor quality (or worse) today.

Furthermore, the lifetime tenancies which turned a rented house into a home for older generations are increasingly a thing of the past. While local authorities and housing associations have been able to make rent properties on a less secure footing for some time, the Housing and Planning Act 2016 requires social landlords to offer only fixed term tenancies from hereon in except in the most exceptional of circumstances. While this may make sense given the high demand for this scarce resource, it clearly leaves future social renters with less security than historically enjoyed.

Whether we look at its more widespread availability, its better quality or its greater security of tenure, it is hard not to conclude that the older generations have been truly advantaged when it came to social housing. Could younger people be offered a similar deal? We wait to see the details from Theresa May today but when Sajid Javid announced a new Green Paper on social housing recently he signalled some big ambitions: to build more social rented properties; to improve the quality and safety of social housing stock; and to “return to the time, not so very long ago, when social housing was valued”.

A renewed social housing sector would clearly be an intergenerational win. But as always the devil is in the details. How will government bolster the capacity of local authority housing and planning departments? What kind of strategic steer will it give to councils on the exercise of compulsory purchase powers? And how can housing associations best be brought into the fray? But if the PM and Secretary of State truly follow through on their warm words, perhaps the manifold benefits our parents and grandparents had as social renters will once again be enjoyed by young people today.

The post Social housing for the younger generations? appeared first on Resolution Foundation.

An additional £2bn for affordable housing – a big deal or just small fry?

$
0
0

It’s the morning after Theresa May committed an additional £2 billion to affordable housing, so is this a big deal or just small fry?

The announcement is clearly significant in a number of key ways. First, this money represents a sizeable bump to the £7 billion the government had already pledged over the parliament for the Affordable Homes Programme (a 35 per cent increase if we want to be exact). Second, the government has indicated that it will change the rules so that local authorities can use the money, potentially ushering in a new era of council house building. And third, by providing examples of how many social rent properties could be built with the cash, the government has breathed some life back into a tenure that until yesterday looked to be in terminal decline.

There may be a number of reasons to temper our optimism however. In the absence of any ring-fence around the new money there is no guarantee it will be spent on properties for social rent alone. As Figure 1 shows, true social housing has become an increasingly small part of the sub-market mix in recent years, supplanted instead by homes built for intermediate and ‘affordable’ rent or for subsidised home ownership.

Figure 1: Increase in market and sub-market priced housing supply 2006-07 to 2015-16: England


Source: DCLG live tables 120 and 1000, June 2017
Note: Year refers to main year in fiscal year

Second, the briefing note that accompanied May’s speech suggests councils will only be able to bid for funds to build new homes for social rent in areas of the country where rents are ‘high’. Quite what ‘high’ means remains to be seen – nominal rents may not always look excessive but as we’ve shown before it is the relationship between these and local incomes that determines affordability. Regardless of where the bar is set, however, the offer to councils may not be wholesale.

And third, even if such worries turn out to be unfounded there is the question of whether local authorities have the capacity to deliver on a new wave of council homes. The National Audit Office estimates that councils experienced a 37 percent estimated real-terms reduction in government funding between 2010-11 and 2015-16, with the settlement for 2015-16 to 2019-20 constituting a further 8 per cent cut in their spending power. Many local authorities are candid about how their planning and housing departments have been hollowed out as a result.

In fact, when we set May’s conference pledge in the historical context we can see that it falls some way short of a return to form. Figure 2 shows the allocations made to affordable home programmes in recent years. As this makes plain, even with the £2 billion top up the current programme remains below the levels of funding dedicated to programmes in the wake of the crisis (and today’s offer is significantly more generous than the one we saw between 2011 and 2015).

Figure 2: Affordable homes spending commitments over time (nominal figures)

Source: UK Housing Review, 2015 and subsequent announcements

A significant shift in government thinking that leads to a renewed social housing sector would be a real intergenerational win. But under Harold Macmillan’s premiership councils built on average 100,000 new homes a year; even with the best will in the world the new funds will only support local authorities to build an additional 5,000 social rented properties annually. Yesterday’s announcement is a start – and we look forward to the new Green Paper on social housing shortly – but possibly not the breaking of a new dawn…


The post An additional £2bn for affordable housing – a big deal or just small fry? appeared first on Resolution Foundation.

Black and ethnic minority workers needs a bigger living standards reward for their astounding progress in getting degrees

$
0
0

On Tuesday, the Government will publish an audit of race disparity across public service outcomes. The data, which will be publicly available, outlines race-based inequality in health, education and employment services, and within the criminal justice system. This is a very welcome development: previous Resolution Foundation research found that such disparities are very real when it comes to differences in living standards. In order to tackle them we need a better understanding of where and how they exist – before of course turning to the really important bit: action to actually do something about them.

Ongoing Resolution Foundation research analysing the link between education, employment and pay gives us reason to be positive about one of these issues: there have been very substantial rises over the past two decades in the proportion of people from Black and Minority Ethnic groups that have a degree. Unfortunately, however, rising educational attainment has not directly translated into an end to big disparities in employment outcomes: on average, graduates from Black and Minority Ethnic groups have lower employment rates and when in work are more likely to be in lower paid occupations than their white counterparts. They are also, on average, paid less despite working in similar types of occupations. Understanding the patterns of, and the drivers behind these inequalities is critical if they are to be reduced over time. That is why we should applaud the government for bringing such important data sources to the fore.

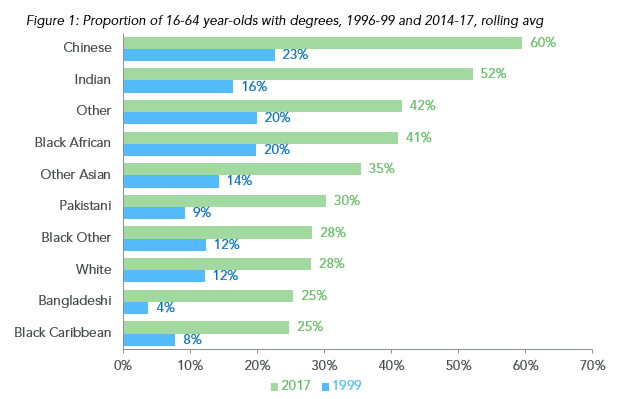
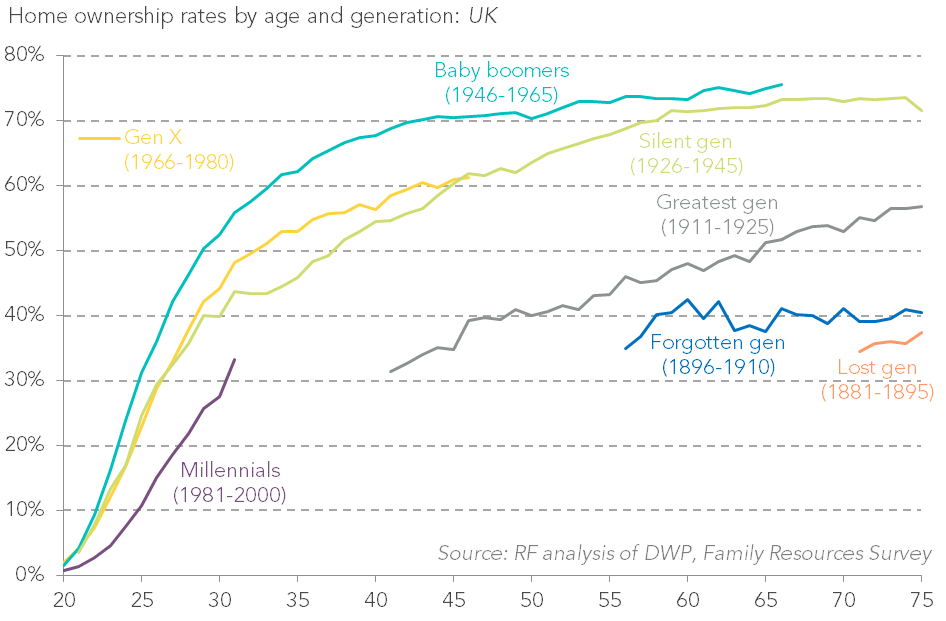
According to the Office for National Statistics’ Labour Force Survey, between 1996 and 2017, the proportion of working age (16-64) people in the UK with degrees (or higher) has more than doubled, from 12 to 30 per cent. Rates of attainment growth vary across different parts of the UK population and this variation is significant when viewed through the lens of ethnicity. As Figure 1 illustrates, the proportion of working age people that hold a degree – by ethnicity – varies from 25% (Black Caribbean) to 60% (Chinese).

Source: Labour Force Survey. Figures for 1996-99 are UK-wide, figures for 2014-17 refer to England and Wales only. Currently enrolled students are excluded.

Even groups that currently have a lower than average proportion of graduates have experienced considerable growth over the past two decades: for example, the proportion of working age graduates with a Bangladeshi background grew by (almost) a multiple of six in twenty years alone. The proportion of graduates with a Pakistani background more than trebled in the same time frame. Some of this is indeed driven by younger birth cohorts, and the age profile of some ethnic groups but while those under the age of 35 do, across all ethnicities, have higher rates of degree attainment, the rough ordering displayed above remains.

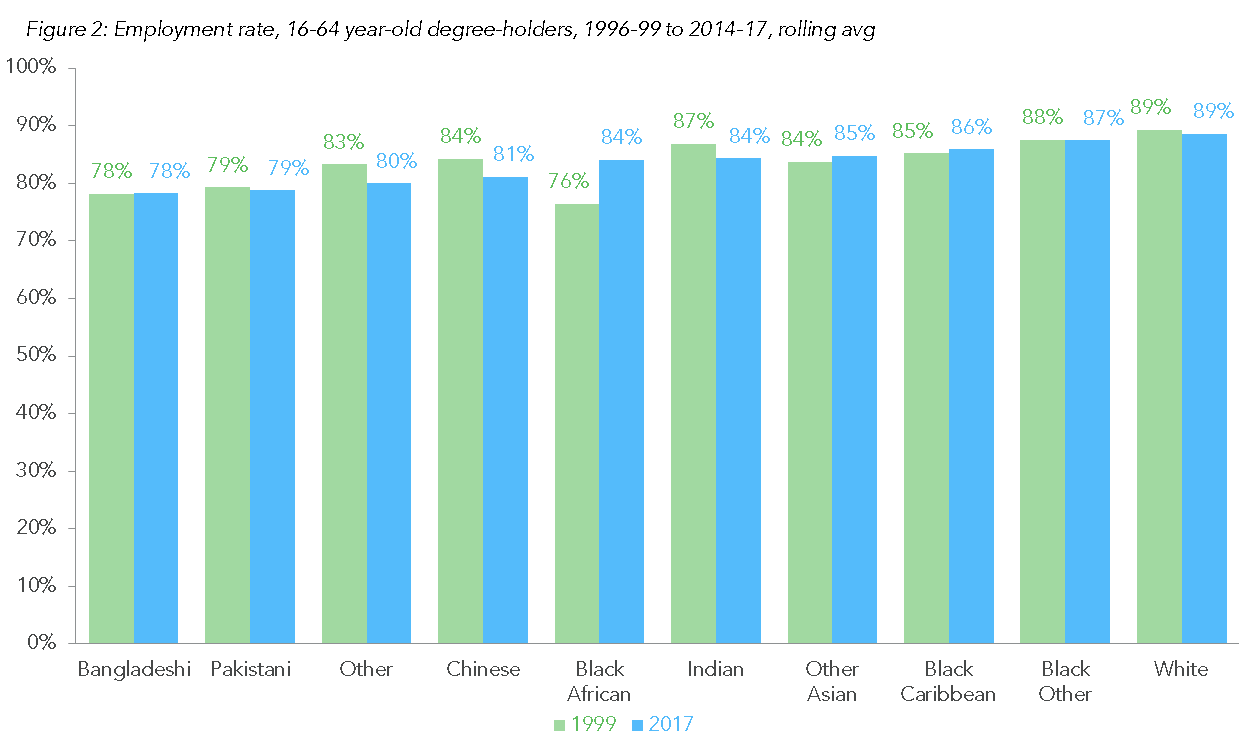
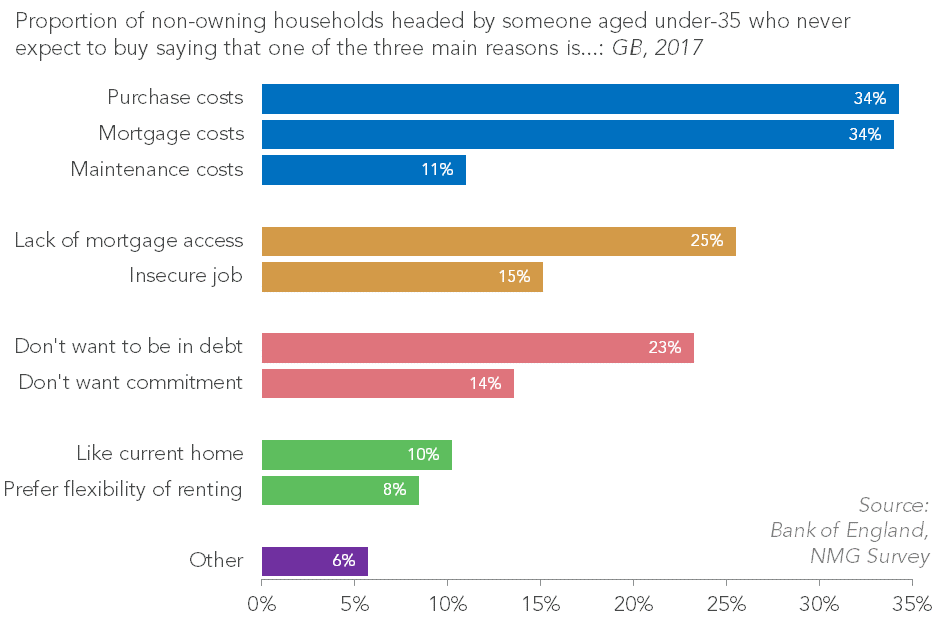
Having a degree, on average, continues to lead to higher pay and better prospects for career progression than not having one. And yet, despite rapid – and substantial – levels of degree attainment, once many Black and Minority Ethnic graduates leave university and enter into the labour market, they have a very different experience from their white counterparts. As illustrated in Figure 2, the employment rate for working age graduates ranges from 78% (Bangladeshi) to 89% (white). With some exceptions (a rise for Black African graduates), these rates have held largely stable over the past two decades.

Source: Labour Force Survey. Figures for 1996-99 are UK-wide, figures for 2014-17 refer to England and Wales only. Currently enrolled students are excluded.

The picture is slightly different when we isolate those under the age of 35: here the gap in employment rates between white and other graduates is larger. For example, the gap between white and Bangladeshi graduates age 16-64 is 10 percentage points; for those age 16-34 (students excluded) is 15 percentage points.  In addition, the above chart does not account for birth cohorts, gender or region, which will likely impact employment and pay figures for different ethnic groups, depending on the extent of regional concentration for each group. All of these factors will be analysed in further detail in a forthcoming Resolution Foundation report.

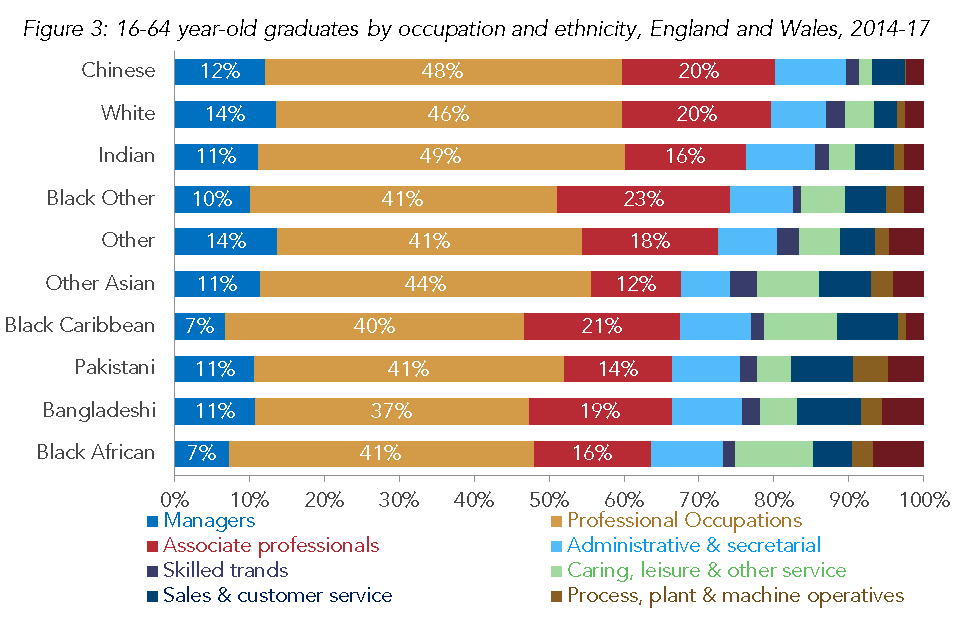
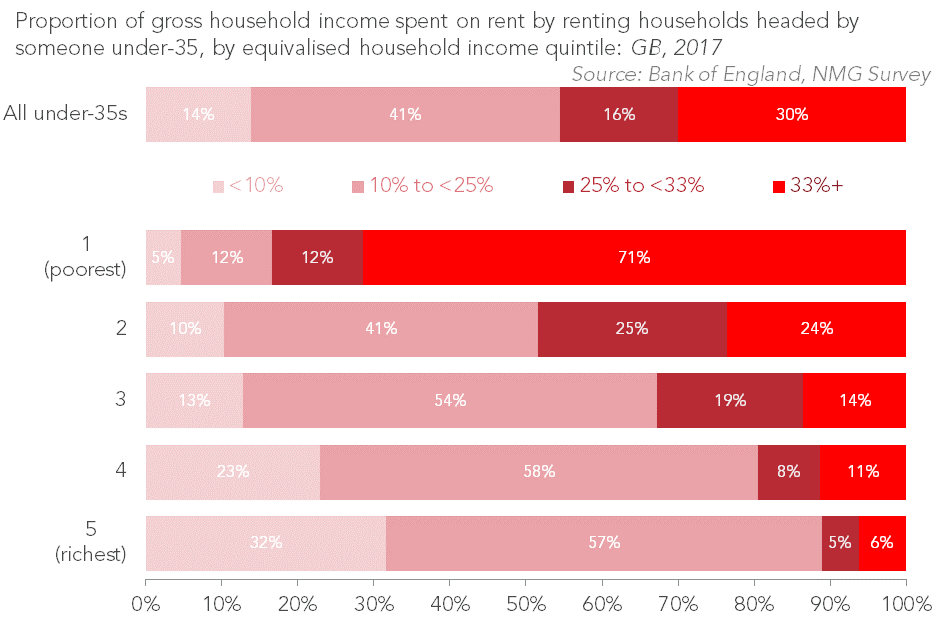
While the employment rate is a good headline indicator of labour market outcomes, it is of course important to understand the types of occupations that those graduates in work are engaged in. The ONS Standard Occupational Classification system separates occupations into 9 different categories, with those in categories 1-3 (managerial, professional and associate professional) typically classified as higher-skilled, and often ‘graduate level’ occupations. Again, when viewing occupational categories through the lens of ethnicity, there are worrying gaps. As shown in Figure 3, roughly 80% of employed white and Chinese working age graduates are in high-skilled, and on average higher paid, jobs as compared to roughly 65% of people with Bangladeshi and Black African backgrounds. Put another way, despite having achieved a degree, nearly 30% of Black African and Bangladeshi graduates work in lower skilled (lower paid) jobs.

Source: Labour Force Survey. Currently enrolled students are excluded.
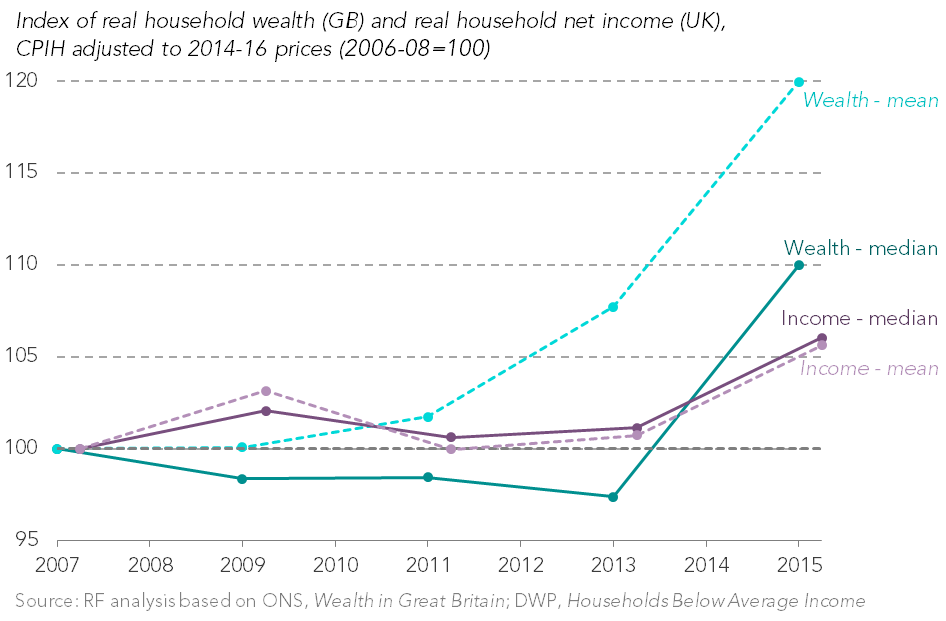
Source: Labour Force Survey

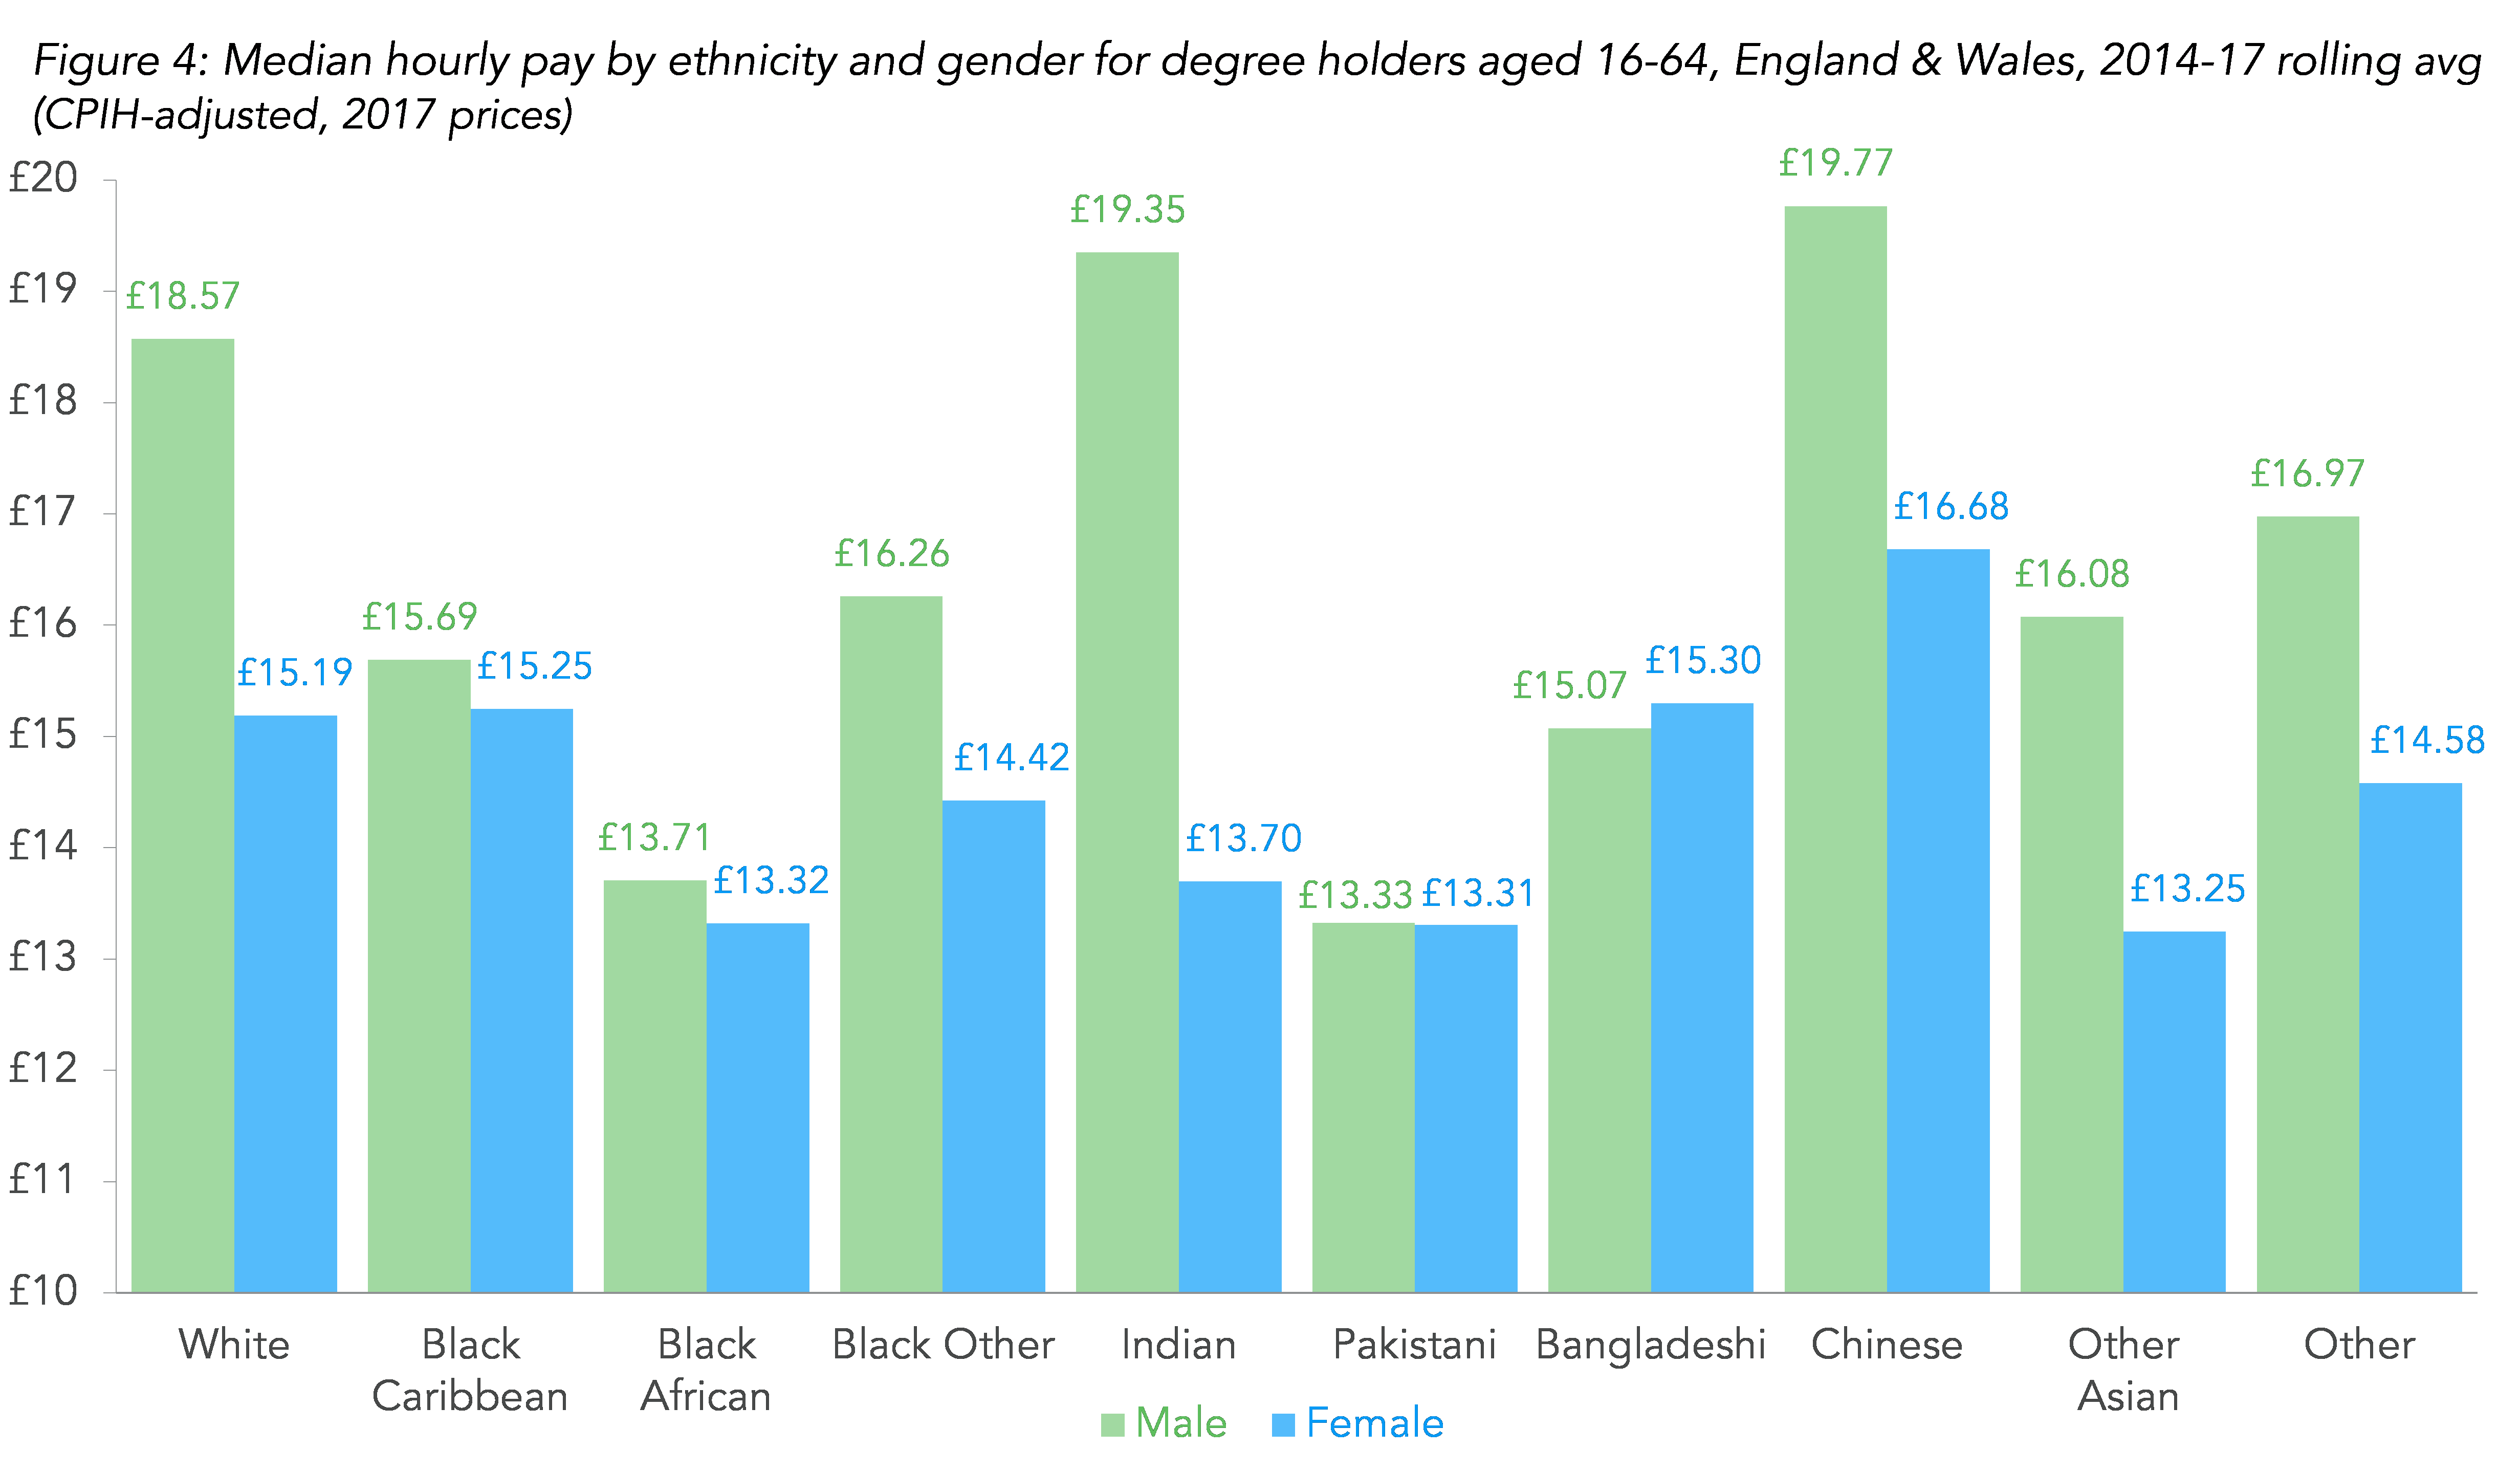
When looking at the pay landscape for different ethnic groups the picture becomes yet more concerning. Figure 4 compares the median average hourly pay for degree holders of all ethnicity categories (available in the LFS data), and includes the gender breakdown within these groups. Whilst Chinese and Indian male degree holders on average are the highest earners at £19.77 and £19.35 respectively, closely followed by white male degree holders with median hourly pay of £18.57, there is a large pay penalty for all other groups by comparison. Almost all women graduates are paid significantly less than their male counterparts, with the exception of Bangladeshi women.

Source: Labour Force Survey

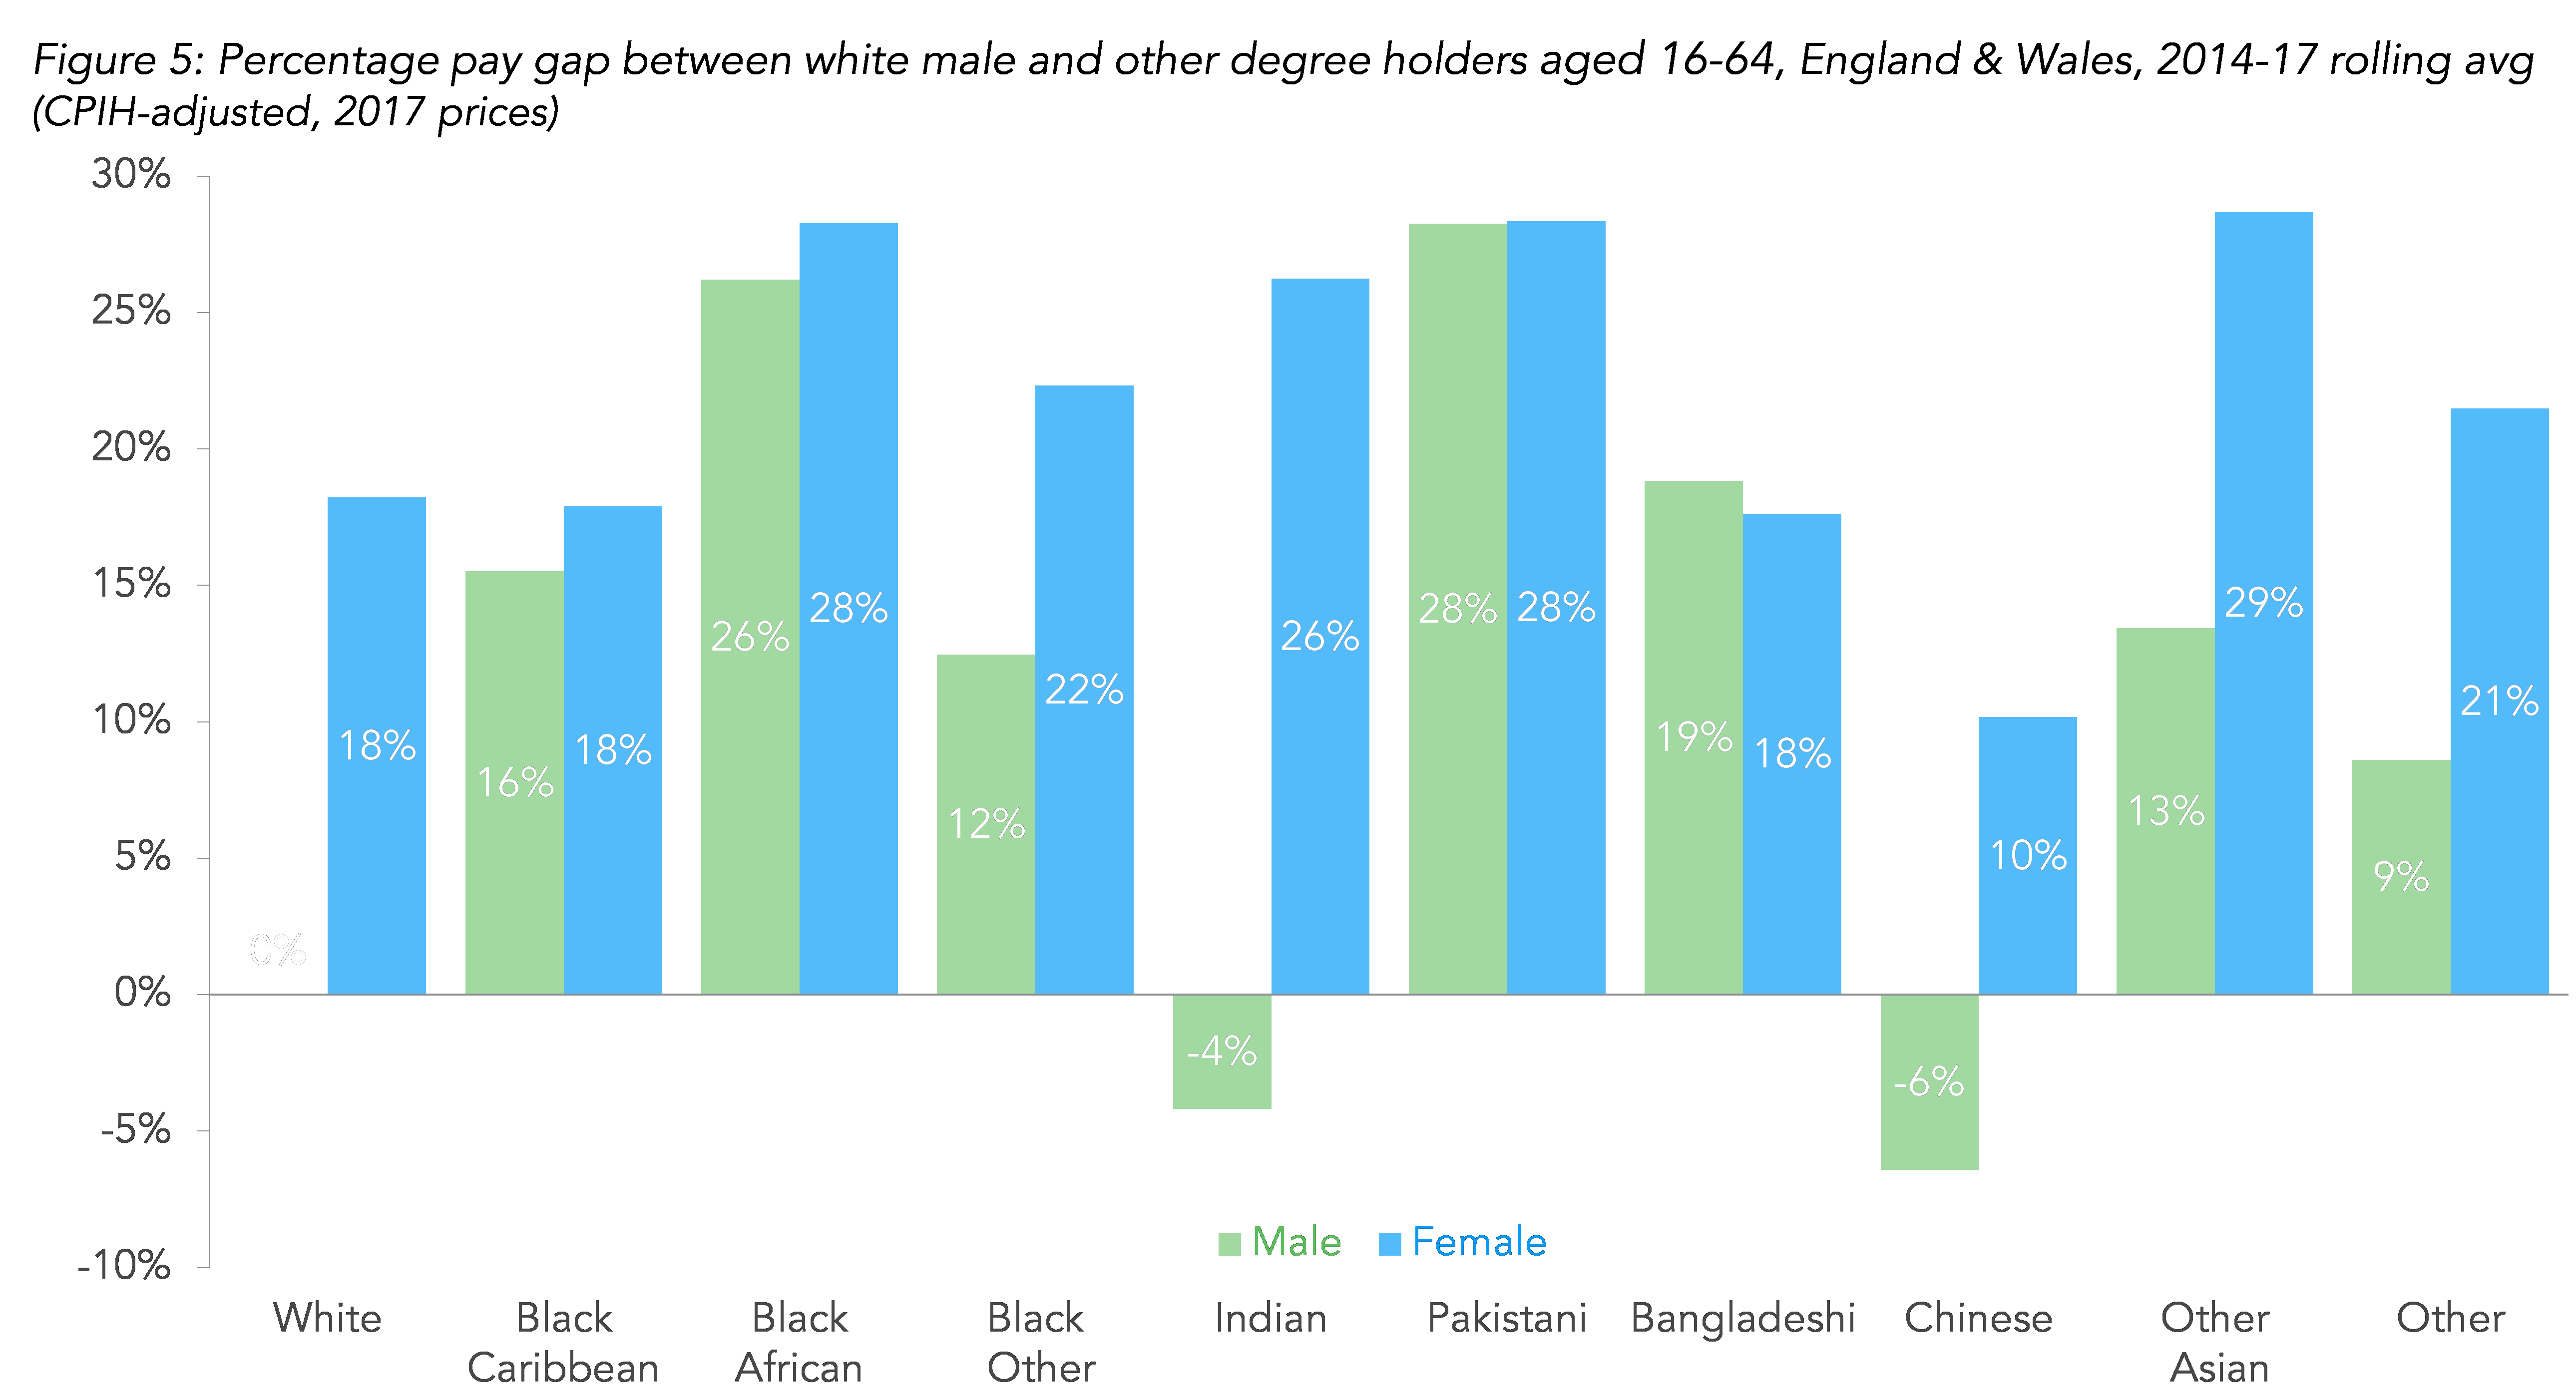
Figure 5 highlights these disparities in terms of the percentage pay gap between white male degree holders and all other ethnicities by gender. As Figure 5 demonstrates almost all groupings appear to have a significant pay penalty in comparison to the white male degree holder population (chosen as the control group as white is still the largest ethnicity in the population, and males have long been established to earn more on average than females), with the exception of Chinese and Indian males.

The largest graduate pay gap is recorded for other Asian women, followed by Pakistani men and women, Black African men and women, then Indian women who all, on average, have a recorded pay gap of nearly 30% less than white male graduates over the last 3 years. Graduate females of all other ethnicities (including the white female population) and Bangladeshi males with degrees also experience a notable pay gap of nearly 20% compared to white male degree holders. This is a concerning finding given that gaining a degree is typically thought of as being a route out of poverty and an opportunity for one to elevate their living standards and earning potential.

Whilst the findings from this most recent analysis are somewhat concerning, it should be noted that this is just a preview of ongoing Resolution Foundation research. These descriptive statistics are a powerful tool for understanding the link between attainment and employment outcomes, and how this varies for different groups and changes over time, yet they currently do not account for variation by factors including gender (in some analysis), age, region, degree subject or birth cohort. For example, compositional factors such as age may affect some of the employment and pay gaps we’ve highlighted. Further, our initial research suggests these factors will play a key role in understanding the challenges faced by Black and Minority Ethnic groups, and by looking at birth cohorts in our in-depth analysis we hope to be able to draw further conclusions into how the gaps have evolved, and whether they have reduced for younger, more diverse cohorts.

What these finding do certainly highlight is the need for a thorough investigation into the challenges faced by Black and Minority Ethnic groups in Britain today. For this reason the Resolution Foundation welcomes the Government’s Race Disparity Audit as a positive step forward in correcting these labour market imbalances, and we hope that by illuminating some of the issued faced by Black and Minority Ethnic people in the UK, policy objectives can start to be formed in response to these challenges.

The post Black and ethnic minority workers needs a bigger living standards reward for their astounding progress in getting degrees appeared first on Resolution Foundation.


Helping or hindering? The latest on Help to Buy

$
0
0

When Sajid Javid announced last month that the government would allocate a new tranche of money to the Help to Buy (HTB) programme he claimed that this would enable “people to make their dream of owning a home a reality”. But is this expensive policy really doing ‘people’ any favours?

When HTB was introduced in 2013, the UK housing market was in the doldrums. Five years on from the financial crisis house building was at an all-time low, supply constraints were widely viewed to be driving up house prices and home ownership was in decline. By offering buyers of brand new homes extra support, HTB aimed both to stimulate new building and to help hard-pressed families with costs – surely a winning proposition?

Four years on, however, and the real world effects of HTB are increasingly plain to see. To begin, from the outset the policy risked stoking house prices, leaving families pursuing an ever-receding goal. As Figure 1 shows, this now looks like it has come to pass. The growth rate for new build properties has diverged from the secondary market in recent months, suggesting the HTB discount is increasingly being ‘baked in’ to the price of new properties by developers.

Figure 1: House price index by type of build (April 2013=100): England Source: RF analysis of ONS house price index

Second, the evidence suggests the programme has substantial deadweight costs. As Figure 2 makes clear those who have purchased a property with a HTB equity loan have an income significantly higher than the median – indeed, 40 per cent of HTB loans have gone to those with annual incomes of £50,000-plus. Unsurprisingly, DCLG’s own assessment of the policy suggests that 35 per cent of HTB recipients could have bought a home in the absence of the subsidy (albeit perhaps a smaller property or one in a less desirable neighbourhood).

Figure 2: Proportion of Help to Buy Equity Loan recipients by income bracket, 2013-2017: England  

Source: RF analysis of DCLG Help to Buy equity loan data, 2017 and FRS

Policies which are self-defeating and poorly targeted are usually left to wither and die. But four years after its inception – and at a cost of £6.7 billion to date – the government is choosing to reinvigorate HTB with the promise of an additional £10 billion of funds for the programme up to 2021. This isn’t just a drop in a large departmental budget either: analysis by the National Audit Office shows that HTB constituted 45 per cent of national government’s housing spend in 2016-17.

All of which begs the question: why the boost for HTB? In the Cameron-Osborne era supporting home ownership was a pre-eminent objective of housing policy, but times are supposed to have changed. The housing White Paper published earlier this year was heralded as ‘tenure neutral’ while the prime minister recently promised £2 billion of funding to support the building of new social homes. Renewing its support for HTB suggests the government’s attachment to home ownership remains intact, but are there other explanations we should also consider?

Could it be as simple as this? HTB is not, of course, a spend but a loan which the government expects to recoup in future years (benefiting from any house price growth that occurs in the meantime to boot). As is the case for student loans, the money the government dedicates to the programme shows up in the public debt, but critically not in the deficit. As a result of its treatment in the public accounts, the government can pump money into HTB without falling foul of its deficit rules.

Whatever the reason for its continued promotion of HTB, the extent of the housing crisis suggests the government must do better than this. While it may have played a useful stimulus role in 2013 it is clearly time to wean builders and buyers off the subsidy, and instead tackle the structural determinants of low supply and high prices head on. £10 billion would build up to 125,000 true social homes; treble that number if some shared ownership and ‘affordable’ rents were put into the mix. This may be an evil in the eyes of the Treasury as it looks to the Budget, but it would be a far greater good than HTB from a living standards point of view.

The post Helping or hindering? The latest on Help to Buy appeared first on Resolution Foundation.

Strictly Come Building: How housing can make a star turn in the upcoming Budget

$
0
0

Lowering expectations ahead of a Budget always helps a Chancellor. And when it comes to expectations of Cabinet members, Boris Johnson and Priti Patel have definitely been in the lowering business. But others have made the Chancellor’s task harder rather than easier. Robert Chote, the chair of the Office for Budget Responsibility, is set to nudge his forecasts in a pessimistic direction. The Prime Minister has racked up some expensive promises that need paying for, from lower tuition fee repayments to reversing tax rises and welfare cuts. And the electorate haven’t helped, cutting an already slim Tory majority down to the point where winning votes on anything controversial is all but impossible.

But when it comes to the top political task of this Budget, rebuilding Conservative support amongst the young, there is someone else causing problems, despite not being part of the official opposition, or indeed an MP, for the last two years. The Chancellor finds himself sandwiched between a do nothing Budget and Ed Balls.

At the centre of this challenge is the role of house building. Many Conservatives have rightly noted that housing is the single biggest issue driving concerns about intergenerational fairness. By a margin of 2 to 1 people now think that today’s young will have a worse life than their parents, and by a huge net margin of 63 per cent believe they won’t have the chance of owning a home their parents had.

It’s that stark discontent that Sajid Javid, the Secretary of State responsible for housing, is tapping into when he says housing is “the biggest barrier to social progress in our country today”. His aim is to build up to 300,000 additional homes in England a year – double the current level of 150,000.

That is a huge increase, and one that simply won’t happen without large amounts of government spending. As is regularly noted, the big fall in house building since the 1970s has been driven largely by the state exiting the construction business.

But to date the government hasn’t followed that evidence through to its logical conclusion: that large state investment in house building is necessary if its targets are to be met. Instead it finds itself stuck announcing welcome but relatively incremental increases in spending, short term and unwelcome moves to prop up demand with Help to Buy and a focus on the process for how homes are bought and sold (which is no help to many of today’s young that have little chance of doing either). These are where you end up when you can’t address the problem head on.

Sajid Javid knows the answer to this problem, arguing recently “we can sensibly borrow more to invest in the infrastructure that leads to more housing, tak(ing) advantage of some of the record low interest rates that we have”.

But, while he is right on the economics, he is wrong on the Budget arithmetic. Almost every economist agrees that an era of ultra-low interest rates is exactly the right time to invest to deliver lasting returns to the nation. But this plan falls foul of the constraints in the Chancellor’s main fiscal rule to “reduce cyclically-adjusted public sector net borrowing to below 2% of GDP by 2020-21”.

Two things are key about that rule. Firstly it treats all capital investment identically to current spending on day to day public services and social security – every extra penny the Chancellor spends on housing counts against it. Secondly the Chancellor is unlikely to have much wriggle room within it, given the speculation that a full two thirds of the £26bn headroom he has could be lost down the back of the OBR sofa because of more pessimistic forecasts.

So the Chancellor’s fiscal rule means he can’t do what Sajid Javid, or I suspect he, would like to do on housing. But why doesn’t he junk a rule that most economists think isn’t fit for purpose anyway? That’s where Ed Balls comes in.

Mr. Balls spent much of the 2010-15 Parliament arguing for capital and current spending to be treated differently in fiscal rules. Having spent years attacking this position Phillip Hammond can’t  now adopt the Ed Balls approach, not least as it’s now the John McDonnell plan.

So here’s a constructive suggestion for getting round the impasse. If the Chancellor doesn’t want to separate out all capital spending, he can make an explicit exception for housing spend. It would open up important options in the forthcoming Budget, and isn’t a policy Labour has ever proposed.

Yes it’s a bit messy, and not what you’d call a first best policy option. But Britain needs housing built and we need our state fully involved in making that happen. And there is a case for treating it differently given that housing investment delivers quicker returns than, for example, rail spending.

There are many ways additional funding could be spent. The current £2.3bn available in the Housing Infrastructure Fund is expected to support the building of 100,000 homes over four years. The government could double the fund and double its impact, as well as reduce restrictions on its use by allowing Housing Associations to bid directly for cash.

The Chancellor could increase funding for new affordable housing. The latest figures out today show that only 40,000 affordable homes were built last year, with the vast majority of these being for ‘affordable’ rent or shared ownership rather than genuine ‘social’ rent.

In terms of scale, an additional £3bn would reverse the cuts to affordable housing capital spending made since 2010 – and potentially deliver as many as 40,000 homes for social rent over the next three years at a time when over a million people are on local authority waiting lists.

Such an approach would underpin a real One Nation Budget. Because on housing in Britain today everyone loses out. Better off households are most concerned about falling home ownership amongst their children, while poorer households have borne the brunt of increases in housing costs (having largely not benefited from the decade of near zero interest rates).

So in his upcoming Budget Philip Hammond doesn’t need to emulate Ed Balls to escape the straightjacket that holds him back on housing, and he certainly shouldn’t start dancing. He can exercise some creativity, set out that housing will rightly be centre stage for this government, and give himself the firepower to make that commitment a reality.

The post Strictly Come Building: How housing can make a star turn in the upcoming Budget appeared first on Resolution Foundation.

Stamping it out? Housing in the Budget

$
0
0

It’s that time of year when we all read the runes from the Treasury in an effort to anticipate what will be announced in the Budget next week. We know the government is acutely aware that nothing ranks more highly with the disaffected young voter than the question of housing. Small surprise, then, that many are predicting the Chancellor will announce at least a temporary reprieve from stamp duty for first time buyers on Wednesday next week. But would such a change really be the intergenerational boost it purports to be?

No-one outside the Treasury has much that is good to say about stamp duty (other than it is very easy to collect). But is it really a critical barrier stopping young people today from becoming home owners? Analysis of UK Finance figures suggests that more than a quarter of (mortgaged) first time buyers purchase properties below the £125,000 threshold, and therefore pay no stamp duty at all. In many parts of the country the tax is not a constraint on buying a first home in a significant way – so what does explain the falling ownership rates of young people?

Our work suggests that it is sluggish incomes, higher house prices and restricted credit which have created the real barriers to home ownership over time. In Figure 1, we track the number of years it has taken the median household headed by a young person to save for the upfront costs of buying a home. As this makes clear, exempting such households from stamp duty would do little to bring the prospect of their becoming home owners back in line with previous generations. The policy would save them just £772 in stamp duty today – a figure dwarfed by the median deposit of over £25,000 they have to find to turn their home-owning dream into reality.

That is not to say there aren’t some first time buyers for whom a stamp duty holiday would make a real cash difference. With the 2 per cent tax paid on homes costing £125,000-plus, and then levied at higher rates on slices of the price over £250,000, it is young people in parts of the country with high house prices who would benefit most from an exemption. So how would the average young Londoner fare? An exemption would save them £8,300 in stamp duty when they buy their first home – a considerable amount of money which could genuinely help some buyers. But as Figure 2 shows, when the length of time the average young household has to save for a deposit in London stands at 35 years, this is hardly a wholesale solution to the capital’s housing crisis (and a sensible cap on the maximum possible exemption could mute its impact even further).

In fact, the affordability effect of taking young people out of stamp duty may be even more attenuated than these charts suggest. A recent study shows that around 40 per cent of the benefit of exemptions accrues to the sellers who simply charge a higher price for their properties than otherwise. The Revenue’s own assessment  is even more damning: an evaluation of the 2010- 2012 stamp duty holiday found “the tax relief has not had a significant impact on improving affordability for first time buyers”. Rather than being the intergenerational leveller the government clearly hopes it will be, exempting first time buyers (average age: 30 years) from stamp duty could end up being a further boost to the wealth of existing home owners (average age: 56 years).

There are many good reasons to reform stamp duty, not least because it inhibits geographic mobility with downward effects on earnings. But with our best estimate suggesting that first time buyers paid between £1 billion and £1.5 billion in stamp duty to the Revenue last year, an exemption would be no small giveaway. When the affordability gains are this small, it is hard to conclude that this would be the best use of public money for a government wanting to help young people with housing. The same amount could fund more affordable homes; invest in infrastructure to unlock sites; or increase the capacity of local authorities to enable them to get building again.

Our verdict overall? The Chancellor is right to recognise the intergenerational fault-line that is housing; but a stamp duty holiday would do very little to bridge the gap, even in London and the South East.

The post Stamping it out? Housing in the Budget appeared first on Resolution Foundation.

Will building more homes help to reduce housing costs?

$
0
0

As part of the Foundation’s ongoing housing work, leading economist and Intergenerational Commission member Kate Barker and Housing market analyst Neal Hudson write about the impact that boosting housing supply could have on prices and wider housing costs.


Since the mid-2000s the dominant narrative about housing in the UK has been around a shortage of supply. In its simplest form, this argument runs: the ONS projects that around 210,000 households will form in England each year. In the ten years to 2016, housebuilding statistics show an average of around 130,000 new homes were built annually. That means we have not met the housing needs of at least 800,000 households over the last decade. As a result, we now need to raise housebuilding to at least 275,000 annually to meet new demand and deal with the backlog.

This orthodoxy has recently been challenged in a series of blogs by Ian Mulheirn who asserts there is, in fact, no undersupply of homes in England today. He puts forward two lines of argument. First, that the rising number of vacant homes in England over the period indicates there is no lack of housing, confirmed by the fact that a lower number of households have formed than the ONS has projected. And second, that with the exception of London, rents and the ongoing costs of home ownership have been falling in real terms – another signal that there is no shortage of homes.

In truth, neither of these accounts is entirely convincing. The story that ascribes all the problems in the housing market to a serious lack of supply doesn’t take advantage of the fuller count of data on net additional dwellings which shows that new annual supply has averaged just over 166,000 in England over the past ten years (Chart 1). Nor does it acknowledge the possibility of changes in preferences – a rising number of students and migrants in the population over the decade means it is reasonable to assume that in aggregate, the desire to form households has changed too. And effective demand will have been subdued by the financial crisis and subsequent weak income growth.

But the argument which says there is no shortage of supply has its own limitations. To begin, as the chart above suggests, it is only when we have census data that we can accurately assess new supply. It also avoids a point about effective supply. There are a number of reasons to think an increasing number of dwellings are not part of the effective housing supply than in the past. Property is more likely to be held simply as a store of value today (no surprise that the highest concentrations of household spaces with no usual residents are found in central London). The number of second homes in England rose by 100,000 between 2008-09 and 2013-14, at least in part because of the increasing proportion of people working away during the week.  And the rise of platforms like Airbnb mean that a growing number of properties are rented out only for the very short term (there are now nearly 50,000 listings on Airbnb in London, for example, 51 per cent of which are entire properties).

The census is also our best data source for the number of households who form over time, making the gap between the household count and available housing stock the difference between two large numbers – both of which are increasingly uncertain. But the really fundamental point is that households can only form if there is a household space available for them to move into, and they can afford to do so. Young people have seen a fall in their wages relative to older age groups in recent years, and are further disadvantaged in the housing market by the increase in house prices caused by lower real interest rates. Any rise in house prices relative to incomes requires a higher loan-to-value (LTV) mortgage or a larger deposit relative to incomes (Chart 2). But at the same time, there is more caution about lending into a market where values might fall so high LTV mortgages have become less available.

This combination of larger deposits and lower earnings has trapped many young people in the private rental sector. While rents may not have outpaced prices over the period they have outpaced earnings (Chart 3). This suggests that supply is after all an issue – given these lower earnings the level of rents might have been expected also to be lower over time

Economic models for house price determination all conclude that rising incomes push up demand (certainly for space) in addition to the rising population.  When incomes rise, houses will need to be supplied at above the rate of (desired) household formation if house prices are to be kept rising at a rate below income growth.  We have done the opposite in England, resulting in average household size ceasing to fall, as fewer than expected elderly single occupiers are outweighed by more than expected households containing young adults living at home and multiple families.

Whether policy should seek to raise supply beyond the latest household projections, and by how much, depends on the outcomes we want in the housing market. To continue at around the 200,000-220,000 of annual new supply, roughly the present situation, would be to continue with many young people at home or sharing in the private rented sector, and many living in overcrowded conditions (which, according to the bedroom standard, has increased in the social and private rented sectors since the early 2000s to around 7 per cent and 5 per cent respectively today).  The rising number of homeless people also suggests a shortage of social rented stock.

However, increasing supply alone will not fully tackle the issue of declining rates of home-ownership.  Some of the shift into private renting may be by choice – although given the relatively insecure nature of the English rental market for tenants, it is hard to believe that since 2003 the extra one million families with children in private renting are all there because that’s what they want. As explained above, younger people are kept out of home-ownership by changes in the mortgage market and lower relative incomes.  We shouldn’t blame a ‘broken housing market’ for factors that are beyond that market, and that won’t be affected by increasing housing supply.  But increasingly supply would reduce these pressures for the young over time (could take at least a decade); homelessness and over-crowding could both be eased; rents might fall a little.  These would all be welcomed by many hard-pressed households.

There are of course wider problems about the distribution of housing beyond the narrow topic of this blog.  It’s partly because of the political intractability of those issues that we need to keep the new build rate up, in order to ensure those at the sharpest end of these wider problems can be housed decently in the future.

The post Will building more homes help to reduce housing costs? appeared first on Resolution Foundation.

Financial distress edges up for the first time in four years, and households are pessimistic about the outlook for 2018

$
0
0


Commenting on the Bank of England’s NMG survey from its Quarterly Bulletin published today (Friday), which found increasing levels of financial distress among households in 2017 and more saying they expect their personal finance situation to deteriorate in 2018 than to improve, Matt Whittaker, Chief Economist at the Resolution Foundation, said:

“Today’s survey highlights a concerning deterioration in households’ personal finances over the past 12 months, which has contributed to the first rise in measures of financial distress in four years.

“While debt repayment burdens remain some way below the levels experienced following the financial crisis, it is worrying that the rise in distress has come against a backdrop of ultra-low interest rates that are expected to rise over the coming years.

“Households’ worsening personal finances and increased pessimism about Britain’s economic outlook suggest that the recent period of consumption-led growth may be running out of track.

“The survey also reminds us that while levels of indebtedness are often viewed through an interest rate lens it is the state of family finances – which have come under real pressure this year – that is the main driver of financial distress in Britain today.”

Key findings from the NMG survey:

  • net balance of 8% of surveyed households say their financial circumstances deteriorated over the previous 12 months;
  • net balance of 4% think things will get worse in the next 12 months (first time this measure has been negative since the question first appeared in 2015); and,
  • net balance of 30% now say they expect the general economic situation to deteriorate in the next 12 months.


The post Financial distress edges up for the first time in four years, and households are pessimistic about the outlook for 2018 appeared first on Resolution Foundation.

Auto-enrolment has had a great beginning. But will it have a happy ending?

$
0
0

We hear a lot about good policy plans gone wrong (Universal Credit springs to mind) for obvious reasons. But we ought to listen (and learn) from successes too. Auto-enrolment into workplace pension savings is the obvious candidate for this cheery policy tale, though the story has only just begun.

Over nine million have signed up in what represents a clear win for one branch of economic theory: harnessing inertia by taking advantage of an expectation that many more people will fail to opt-out of a savings scheme than would ever sign up to if asked. But the continued success of auto-enrolment is dependent on another powerful economic force: the value people place on the income they have available to spend today, over what they may have in future.

So far this trade off hasn’t been an issue as the minimum contribution level for an auto-enrolled employee is just 1 per cent. That’s precisely how much many new savers are contributing. Even so, the extent to which coverage has increased is phenomenal. As the chart below shows, auto-enrolment has been particularly successful among the low paid and women, who historically have tended to not save at all. Looking across generations, pension coverage is one wealth indicator where millennials are outperforming baby boomers when they were the same age. This is in sharp contrast to Britain’s other big wealth indicator, housing.

These current savings patterns will only crystallise as pension entitlements in the future. For most that is still many years away. By boosting private saving now Resolution Foundation modelling from a recent report for our Intergenerational Commission projects that for future retirees, income will remain broadly stable (see chart below). The State Pension is admittedly doing a lot of the work, but over the long run, income from Defined Contribution (DC) schemes will broadly replace that from final salary schemes (Defined Benefit schemes). Of course there are important differences between the two, particularly the increased risk placed on individuals via DC schemes. However, the future looks far more reassuring than many millennials perceive it to be.

So the long-term outlook for retirement living standards is rosier than many perceive. But we still expect all but the very lowest earners to fall short of the benchmarks for an adequate retirement as set out by the Pension Commission (see chart below). And some generations are more likely to fall short than others. That’s why the moves to boost saving set out today, by starting employees off earlier from age 18 and expanding the range of earnings on which contributions are made, are welcome.

The key to pension saving is to start early. And that’s the problem for many people in the middle of their working lives – caught between the decline of DB pensions and the rise of auto-enrolment. For future retirees from Generation X, auto-enrolment may have come too late, and they’ll see a bigger dip in their post-retirement adequacy as a result. Any move to improve the situation will need to come quickly.

Age isn’t the only barrier to saving enough – the type of work you do makes a big difference too. The self-employed – who now represent one in seven workers – are chronic under-savers. The government is looking closely at how to change this but time is of the essence. Trialling new policy levers asap is a good next step, but firm and decisive action is needed quickly. But that’s going to be tough for the government given the lack of space on the legislative timetable and weak political position to forge a lasting consensus in any policy area.

And of course, the biggest key to saving is the amount being saved – and the amount people are able to save. The interaction between these two over the next few years will hold the key to the ultimate success of auto-enrolment.

Employee contribution rates are set to rise to 5 per cent (including tax relief) by April 2019. That’s a big increase and one that will be needed just to meet the projection we set out above. But here is the rub, saving more now to boost future incomes means a necessary reduction in pay packets today. That’s an increasingly tough choice when we take into account the very weak outlook for wage growth. For a typical worker, the additional pension contributions are equivalent to an over £900 a year drag on pay by April 2019, and a negligible real rise in pay from today.

So far inertia has trumped concern over immediate pay packet effects, an impact that has likely been helped by income tax cuts. Such offsetting support is likely to dissipate in the coming years, though the lowest paid should see some boost from increases in the National Living Wage. Our research has shown that if coverage stalls  – falling halfway between pre-auto-enrolment coverage rates and the government’s post-auto-enrolment expectation – up to a fifth of millennials will have lower entitlement when they retire, with the greatest impact among low to middle earners.

The government must stand ready to act to keep private pension savings on track. Precisely how is an issue the Intergenerational Commission will return to early in the new year and one that is key to maintaining the intergenerational contract across all future generations of pensioners.

The post Auto-enrolment has had a great beginning. But will it have a happy ending? appeared first on Resolution Foundation.

Time for some housing honesty

$
0
0

The return to work after Christmas is never easy. Unless you’re an estate agent: they love January. Following the pre-Christmas lull, families rush back into wanting to buy and sell their houses (helped in part by the traditional post-festivity spike in family breakdown). But for an increasing number of us, house hunting is becoming little more than an exercise in window shopping (or ‘property porn’ if you’d rather).

The share of the population owning a home has been falling since 2003, with particularly profound consequences for younger families. As the chart below shows, today’s 30 year olds (that is, the oldest members of the millennial generation born between 1981 and 2000) are only half as likely to own their house as their parents were at the same age.

Like so much of the Christmas TV schedule, this is a story that’s been on repeat for some time. Britons get that their country is no longer a nation of home owners. As research carried out by Ipsos MORI back in the summer for the Intergenerational Commission showed, 71 per cent of people (across all generations) think millennials face worse prospects than their parents in this regard. Just 7 per cent think young adults are better off. Indeed, of all of the questions asked in the survey, it was the one on which respondents were most pessimistic.

Yet, despite being pessimistic about the overall picture for millennials, new data shows that a significant share of the generation think they personally will manage to beat the gloom. The next chart takes data from the Bank of England’s latest NMG survey to show that more than half (52 per cent) of non-owning households headed by someone aged under-35 (roughly speaking, the millennial generation) expect to buy at some point in the future. And that proportion holds up even among lower income millennials.

If such expectations were borne out, around 75 per cent of millennial households would eventually own a home. That would put the generation on a par with the home ownership rates recorded among baby boomers. It would also be roughly 10 percentage points higher than the ‘optimistic’ scenario we set out in September (our ‘pessimistic’ scenario put the figure under 50 per cent). Short of a significant turnaround in housing trends, the implication is that many members of the younger generation will find their aspirations go unmet.

And, while the one-in-four (24 per cent) non-owning millennials who think they’ll never buy a home might have a more realistic outlook of the future, they’re just as likely to be unhappy with their lot. The next chart sets out the factors which this group identify as being among the three most important reasons for not owning. What stands out is that just one-in-ten of them cite positive-sounding reasons: 10 per cent say they like their current home and just 8 per cent prefer the flexibility of renting. The upshot is that as few as 1 per cent of millennials appear to be happy with the idea of never owning a home.

It’s this finding that goes a long way to explaining why politicians are so keen to be seen to be offering hope on home ownership.

And, with ‘purchase costs’ (such as the deposit, stamp duty and estate agents fees) being cited by millennials as the main barrier to owning, it’s easy to understand the temptation to focus on subsidising buyers. Measures such as the removal of stamp duty for first time buyers of property worth up to £300,000 – which Philip Hammond announced in the Autumn Budget – give the impression of extending home ownership to a wider group. But they largely miss the mark. The OBR’s assessment of the stamp duty policy was that it would benefit just 3,500 first time buyers who would not otherwise have been able to buy a home, costing roughly £160,000 per additional owner.

Supply-based approaches represent a preferable and more sustainable option, but they take time to take effect. That’s not to say government should give up, and the Autumn Budget plans for returning housing capital spending back to the levels of the 2000s (outside of the fiscal stimulus peak of 2008-10) is a very welcome one.

But it’s hard to escape the conclusion that, even if we get to grips with the longer-term problem, home ownership will remain off-limits for significant numbers of millennials. Some might expect to benefit from the bank of mum and dad in the near-term and from inheritances as they age. But such support may come too late to cover expensive family-rearing years for many households, and will never arrive for many – mainly lower income – others.

That reality raises a number of challenges for today’s young people. Over the longer-term, home ownership plays an important role in building wealth (via semi-enforced saving), providing leverage and hedging against costs and location in retirement. In its absence, alternatives are needed.

More immediately, the generally higher housing costs associated with renting leave young people with less disposable income and less opportunity to save than earlier cohorts faced. The chart below sets out the share of income allocated to rent among younger respondents to the NMG survey. It shows that 30 per cent of renters in this group spend more than one-third of their pre-tax income – a threshold that is often taken as a sign of housing unaffordability. And that figure jumps to a massive 71 per cent among the poorest fifth of millennials.

We’ll turn to the question of how the country might rise to these challenges in a forthcoming policy options paper for the Intergenerational Commission. But our politicians – unlike our estate agents – need to be more honest about the housing aspiration gap. It’s good to offer hope, but a healthy dose of realism would sharpen the focus on the broader living standards challenge posed by our housing crisis.

The post Time for some housing honesty appeared first on Resolution Foundation.


Causes and Consequences: The role of household debt in 21st Century Britain

$
0
0

The growth in household debt has outpaced growth in household incomes in recent years, putting questions about the causes and consequences of higher debt back in the spotlight.

Should we worry that higher debt means that another credit crisis could be brewing? Or is growing household debt instead an indicator of rising consumer confidence? What is the profile of debt across different households and who is most exposed to rises in interest rates? How sustainable is the UK’s level of household indebtedness?

At an event at its headquarters in Westminster, the Resolution Foundation will present findings from new research on shifts in household debt across Britain. A panel of experts, including MPC member Dr Gertjan Vlieghe, will then offer their take on debt, from what it means for the macroeconomy to its impact on individuals and families.

The post Causes and Consequences: The role of household debt in 21st Century Britain appeared first on Resolution Foundation.

Britain has excelled at generating wealth – but lower income families are being left behind

$
0
0

Typical wealth across Britain increased by 13 per cent in real terms in the two years to 2014-16, but wealth inequality remains unacceptably high, the Resolution Foundation said in response to the ONS Wealth and Assets Survey today (Thursday).

Over a period in which typical household incomes have grown by just 5 per cent, today’s figures show that Britain has continued to excel at generating wealth – growing more than twice as fast as incomes – and reaching a record high of £12.8 trillion.

However, Britain has largely failed to distribute this wealth across the country, with lower-income households missing out. Typical wealth among the poorest fifth of households fell in real-terms between 2012-14 and 2014-16.

Wealth inequality remains nearly twice as high as income inequality (the gini coefficients are 0.62 and 0.35 respectively). The Foundation notes that while total wealth inequality has been static over the last decade, falling home ownership has driven up housing wealth inequality, while the growth of private pension coverage, accelerated by auto-enrolment, has lowered inequality.

Age inequalities have also growth in past decades with recent Resolution Foundation research finding that the baby boomer generation hold around half of the nation’s wealth, while millennials account for just 2 per cent of it.

The Foundation adds that the sheer level of wealth across Britain shows that we need to do a far better job of taxing it. Recent RF analysis has found that revenues from wealth taxation have remained flat as a share of GDP for half a century, while wealth has more than doubled compared to national income.

Conor D’Arcy, Senior Policy Analyst at the Resolution Foundation, said:

“Britain is very good at generating wealth, but terrible it spreading it around the country and even worse at taxing it properly. As a result, we have unacceptably high levels of wealth inequality.

“Young people in particular are feeling the effects of Britain’s wealth divide. Our large millennial generation own just 2 per cent of the nation’s wealth. This stems from their struggle get on the housing ladder, boosting other’s people wealth in the private rented sector, rather than build assets of their own.

“Given the huge fiscal pressures Britain will face in the coming years and decades, it is vital we do a better job of distributing and taxing wealth. Otherwise we will simply put more and more pressure on working households.”

The post Britain has excelled at generating wealth – but lower income families are being left behind appeared first on Resolution Foundation.

Seven key takeaways on the level, profile and distribution of Britain’s £12.8 trillion of wealth

$
0
0

We get monthly updates on pay and authoritative data on household incomes every year. But we have to wait two years for a detailed breakdown of what’s happening to wealth across Britain. Here are seven key takeaways from the latest data published today and what it tells us about changes in the level, profile and distribution of Britain’s wealth.

  1. Britain has excelled at generating wealth

Total wealth in Britain stood at £12.8 trillion from 2014-16, a 13 per cent real-terms increase in two years. And this isn’t a one off boost; average net household wealth has risen by 20 per cent over the decade or so covered by the ONS’s Wealth and Assets Survey. That far outstrips the performance of average household incomes, which have risen by just 5 per cent over the same period.

  1. But that wealth is very unequally spread

Britain is great at growing the wealth pie, but rubbish at sharing it out. This is obvious from its Gini coefficient (where 1 would be if one person had all the wealth while 0 would be everyone having the same amount of wealth). With a Gini of 0.62, a figure that has barely changed over the last decade, wealth remains very unevenly distributed, nearly twice as unequal as incomes.

But just tracking these headline changes overlooks trends in certain kinds of wealth. Pension wealth, for example, has become more evenly distributed in recent years with auto-enrolment contributing to the most recent drop. Property wealth on the other hand has become less equally divided, with falling ownership and rising prices meaning a shrinking group who own their own home have experienced significant uplifts in their wealth. That’s in contrast to the pattern of the mid-90s to mid-00s when increased homeownership spread wealth, as documented in previous Resolution Foundation analysis.

  1. The lowest-income households fared worst in recent years

We can also look at how wealth is held across income levels. Unsurprisingly, the lowest income households have the least wealth. Of greater concern, however, is the pattern of recent years. The typical wealth of the poorest fifth of households fell between 2012-14 and 2014-16. In contrast, households in the ninth decile experienced a 27 per cent increase. Resurgent house prices particularly in London and the South East are likely to have played an important role in this growth at the top.

  1. Londoners’ wealth has galloped ahead of the rest of Britain

When it comes to geographical inequality, households in London and the South East are, as you’d expect, wealthier than average. This gap has grown over the last decade as typical household wealth in London has raced ahead of the rest of the country. While median household wealth in London is 62 per cent higher than in 2006-08, in both the North East and the East Midlands it remains 14 per cent lower. House prices again appear to be the main driver of this; typical property wealth in London has doubled over a decade, while it has fallen in real terms in every other region and nation.

  1. But there are wide inequalities within London too

Though typical households in London have experienced much faster growth, this does not tell the full story. Less wealthy households in London (those a quarter of the way up the distribution, or ‘p25’) have £35,000, lower than any other nation or region. London’s younger and larger immigrant populations are likely to play some role in this as well as the high cost of housing.

  1. Rising wealth has not been equally shared across the generations

It’s no shock that younger people have less wealth than older households. But comparing the wealth held by those in their 30s today to the wealth of those in their 30s nearly a decade ago can tell us whether today’s young people are keeping pace with their predecessors. Real average household wealth has fallen over the past decade for 35-55 year olds, but increased by a quarter for those aged 65+. While growth is also visible for those aged 25-34, some of this is likely to be due to more of them living in parents’ homes as this data focuses on households.

  1. Auto-enrolment has helped but the fall in pensions inequality pre-dates it

While many of these housing-related trends seem unlikely to be reversed in the short term at least, the picture on pension wealth is a reminder of the power of well-designed policy interventions. Auto-enrolment has helped 9.2 million employees to save towards their future, with women and younger workers among the main beneficiaries. It’s worth noting, however, that when it comes to what’s driven falling pension wealth inequality, it’s not all about auto-enrolment. After all, the Gini coefficient for pension wealth fell most between 2008-10 and 2010-12, before its introduction.

In summary, Britain has lots of wealth – and lots more than it did a decade ago. But Britain is also a country of major wealth divides that cut across income levels, regions and generations. What’s most remarkable of all, though, is the lack of debate about whether these trends are good or bad – and what policy can do to change it. Given the huge economic pressures Britain faces in the coming years and decades, it’s high time we had a proper debate about the scale, distribution and taxation of our wealth. That’s a debate our Intergenerational Commission will be looking to spark in the coming weeks and months.

The post Seven key takeaways on the level, profile and distribution of Britain’s £12.8 trillion of wealth appeared first on Resolution Foundation.

How to solve the UK’s growing wealth gaps

$
0
0

This year, average wages are set to be flat. British households, meanwhile, are in the middle of a projected four-year income stagnation. And our productivity has barely risen since the 2008 financial crisis.

Pay, incomes, productivity – that all are flatlining is the defining feature of our economics and our politics today. There’s a reason calling a general election in 2017, as wages fell, was a risky choice by Theresa May.

But one economic number that we rarely discuss has been increasing for some time: wealth. The value of land, it was recently reported, has increased by 412 per cent since 1995; UK households have £12.8tn of wealth. Crucially, our wealth is growing much faster than our income. Between 1955 and the 1980s, wealth was steady at two and a half times national income. Today, it’s closer to seven.

Why does wealth growing much faster than income matter? Because it means that in 21st century Britain, it is no longer truly possible for someone to earn their way to wealth. The entry price to become one of the wealthiest 10 per cent of families is now £1.2m. A typical family, with an income of just over £28,000, obviously can’t expect to make it into that club – they’d have to bank every penny for 43 years. But even a family doing particularly well, with an income of £60,000, putting them in the top 10 per cent by annual income, would have to save everything for 20 years to reach the wealthiest 10 per cent. Or, to put it another way, they will never get there.

And that’s before the second trend – a wealth inequality tipping point. The 20th century delivered huge reductions in wealth inequality. You may have noticed there are fewer landed gentry about. By some estimates, the top 1 per cent had 70 per cent of all wealth in 1900. World Wars, progressive taxation and surging home ownership reduced that to less than 20 per cent by the 1980s. But there is no guarantee this trend will continue: property wealth is now becoming more unequally distributed with home ownership falling. That should trouble us all: inequality of wealth is almost twice as high as that of income.

If these two trends continue, only those born into money, or who marry into it, will constitute Britain’s wealthiest. That reality should alarm socialists on the left and meritocrats on the right. To paraphrase the French economist Thomas Piketty, who was born with what and who marries whom might make for a good Jane Austen novel, but it can’t be an acceptable answer to the kind of country we want to build.

What should all of this mean for politics and policy? Some of it is far from inevitable and reflects unambiguous policy failures. Building more homes and reducing incentives for people to demand second or third houses should be an immediate priority.

We also need to actively address wealth inequality by helping more people build some assets up. The success of pension auto-enrolment in enabling more women and low earners to save for retirement needs to be replicated for the self-employed. And we should revive the idea of asset-based welfare – because the state should help low-income families acquire assets, not merely subsidise their low incomes.

Inheritances, which are forecast to double over the next two decades, are crucial. Encouraging families to share that wealth around would help, so inheritance tax should be paid by recipients with an allowance, rather than by estates. Collective inheritances, such as social housing and decent infrastructure, are also a vital way to ensure that Britain has something to offer you even if your parents can’t write a cheque.

Though we can’t stop wealth playing a big role in society, we can make it pay its fair share. Wealth has more than doubled as a percentage of national income since the 1980s, but the amount of tax we collect from it has been frozen at around 4 per cent of GDP.

Poorly thought-through manifesto raids on wealth are unwise, but inaction on its taxation is not tenable given the strain on the public finances in the coming years, as Britain’s large baby boomer cohort (who hold a disproportionate amount of this wealth) move from paying taxes to receiving pensioner benefits. If wealth doesn’t take more of the strain, income or consumption taxes will have to – or our public services will deteriorate.

Wealth differences also risk bleeding into other areas of life where they do not belong. Wealth status could determine not only where you live, but the education you get, the risks you can take and the jobs you can do. Policy should aim to directly counter those pressures. And we must, at all costs, stop these wealth gaps infecting our politics by introducing further controls on election spending.

As a country, we find discussing wealth rather awkward. But that’s something our politics will have to overcome – because wealth is profoundly reshaping Britain.

This article originally appeared in The New Statesman

The post How to solve the UK’s growing wealth gaps appeared first on Resolution Foundation.

An unhealthy interest? Debt distress and the consequences of raising rates

$
0
0

Standing at nearly £1.9 trillion, UK household debt remains a big issue. It is one that has very real and very obvious relevance for those families having to meet repayment commitments. But it is one that has macroeconomic implications too: the debt hangover that has endured over the past decade has undoubtedly hampered the UK’s recovery from the financial crisis. It is unsurprising therefore that the recent ‘surge’ in consumer credit growth has provoked some concerns that households are once again storing up problems for the future – especially with interest rate rises expected over the coming years.

The good news is that much of the credit ‘surge’ appears to have been associated with borrowing by higher income households, who we would expect to be relatively well placed to deal with future shifts in circumstance. And many of the credit market fundamentals look much improved relative to the pre-crisis period, with tighter lending criteria and closer monitoring of potentially unwelcome developments.

But while the flow of credit may be much improved, the stock remains substantial. Increases in the base rate will inevitably increase costs for many indebted households and have the potential to further increase the debt ‘distress’ faced by some.

In the absence of a further major economic shock, the fall-out from future rate rises is unlikely to pose serious affordability issues for the majority of borrowers however. The base rate is expected to rise only gradually, and to remain well below past norms. With such rises taking time to feed through to borrowing costs – and even then not necessarily in full – most indebted households are likely to be able to comfortably continue to meet their credit commitments.

But the evolution of debt and interest rates will almost certainly create significant difficulty for a minority of households. Predicting how many households will fall into this minority is difficult – the future is inevitably uncertain – but it is clear that lower income borrowers and those with ‘atypical’ characteristics appear most exposed.

With this in mind, it’s important that – along with continuing to ensure the flow of new borrowing is of sufficient quality – regulators and lenders alike are sensitive to the ongoing problems associated with the pre-existing debt overhang.

The post An unhealthy interest? Debt distress and the consequences of raising rates appeared first on Resolution Foundation.

Viewing all 60 articles
Browse latest View live


Latest Images