Quantcast
Channel: Housing, Wealth and Debt – Resolution Foundation
Viewing all 60 articles
Browse latest View live

Worries about recent debt surges are exaggerated but almost half of lower income households are displaying signs of ‘debt distress’

$
0
0

A surge in consumer credit growth and the prospect of faster-than-expected interest rate rises have recently prompted concerns about the possibility of a fresh debt-bust in the UK, but it is the continuing overhang from the last crisis that is of more concern, according to a new Resolution Foundation report published today (Monday).

With levels of consumer credit rising at just under 10 per cent over the course of the last year, overall household debt now totalling £1.9 trillion and the Bank of England stating last week that interest rates may rise faster than previously expected, An Unhealthy Interest? asks how worried we should be and what might happen when rates start to rise.

The report shows that most households look relatively well-placed to cope with rising rates. The cost of servicing Britain’s household debt is low by historical standards, with repayments currently accounting for 7.7 per cent of disposable income. This is well below the 12.3 per cent recorded just before the financial crisis, and in line with the level seen during the mid-1990s and early 2000s.

The Foundation says the recent surge in consumer credit has been driven primarily by higher income households who are well placed to keep up repayments over the coming years. Much of the growth in consumer credit has been associated with dealership car financing, which places much of the risk on lenders rather than borrowers. It notes too that while debt servicing ratios increased last year for the top three-fifths of households, they actually fell for the poorest fifth.

However, while this new borrowing is not as troubling as some have claimed, a significant number of households continue to have high debt burdens. Households headed by someone aged 25-34 spent nearly £1 in every £5 of their pre-tax income on debt repayments in 2017, compared to 20p for households aged 65 and over.

Even in today’s low-rate environment, many households display signs of ‘debt distress’ the Foundation said. Around three in ten working age households show at least one sign of debt distress, including 21 per cent who have had difficulty paying for their accommodation and 17 per cent who find unsecured debt repayments a heavy burden.

The proportion of households in some form of debt distress rises to almost half (45 per cent) among the poorest fifth of working age households, with over a third experiencing difficulty in paying for accommodation and one in six in arrears on either their mortgage or consumer debts.

To illustrate how households might cope with rising interest rises, the report models the impact of an overnight 2 percentage point increase in mortgage rates, while noting that in reality borrowing costs are likely to build much more gradually.

It finds that such a scenario would cause a modest increase in the ‘at risk’ population of households spending 30 per cent or more of their pre-tax income on mortgage debt servicing. Currently 12 per cent of mortgagor households sit above this threshold, with the Foundation modelling suggesting that this figure would rise to 15 per cent (1.1 million households). Among mortgagors in the poorest fifth of the country, 57 per cent are already believed to be in the ‘at risk’ group, rising to 59 per cent in the modelled scenario.

The report says that overall UK households are well prepared for a new era of slow, measured interest rate rises. But it adds that the scale of the enduring debt overhang would make any return to pre-crisis interest rate levels “catastrophic”, taking debt servicing costs to levels above those seen before the financial crisis. And it warns that the Bank must continue to monitor the distribution of debt across households in Britain as it embarks on further tightening.

Matt Whittaker, Chief Economist at the Resolution Foundation, said:

“Rapidly rising consumer credit and the prospect of faster interest rate rises have led some to warn loudly of the imminent bursting of another credit bubble. But these fears appear to be overblown, with much of the recent credit growth being driven by higher income households who are much better placed to service their debts.

“However, while the recent growth in debt is less of a concern, it is very worrying that almost half of low income families are already showing signs of debt distress. While rates have been at historic lows for a decade now, many families have experienced a tight income squeeze over this period and have not been able to get back on the front foot when it comes to servicing their debts.

“While the evidence shows that on the whole Britain is well prepared for future interest rate rises, policy makers must have regard for those low income households who are already struggling to pay off their debts, and who could be really exposed if interest rates go up faster than currently expected.”

The post Worries about recent debt surges are exaggerated but almost half of lower income households are displaying signs of ‘debt distress’ appeared first on Resolution Foundation.


Baby boomers face a choice between higher capital taxes or lower take home pay for our children, warns Lord Willetts

$
0
0

Increase in spending by 2040 will be equivalent to a 15p income tax rise unless other tax revenues are found

In a major speech today (Monday), Resolution Foundation Executive Chair Lord David Willetts will warn that Britain faces tough choices about how to pay for rising health and welfare costs in Britain, and who is going to pay for it.

He will say that people of all generations should pay for these rising costs, and that higher capital taxes are needed if we’re to avoid putting the entire tax burden on young people who are already struggling to match the living standards gain of older generations.

He will warn that failing to face this challenge together risks widening intergenerational divides at a time when the country needs to be brought back together and the social contract between generations repaired.

In a speech that will signal where the Foundation’s Intergenerational Commission is heading when it concludes in a few months’ time, Lord Willetts – who chairs the Commission – will say:

“For 30 years Britain has enjoyed a time when the baby boomers were at their peak earning power. We benefitted from lower pressures on public spending. Politicians talked as if tax cuts were the normal state of British politics.

“But we are now at a tipping point. The baby boomers are moving into retirement and there are fewer younger working age people coming up behind them.

“As we at last emerge from deficits the recession gave us in this decade we need to look forward to the pressures an ageing population is set to give us in the next.

“Politics is going to be very different as the baby boomers retire. The age of tax cuts is over.”

He will cite new Resolution Foundation analysis showing that by the end of the decade (2030), welfare spending (education, health and social security) is set to rise by the equivalent today of £20bn a year, and by the equivalent today of £60bn by 2040.

This extra spending – which is almost entirely driven by rising health costs – would translate today to an income tax rise of 15p in the basic rate to cover the funding gap in 2040. He will say:

“The time has come when we Boomers are going to have reach into our own pockets. The alternative could be an extra 15p on the basic rate of tax, paid largely by our kids.

“Is that kind of tax really the legacy we – a generation who own half the nation’s wealth – want to bequeath our children and grandchildren?”

Lord Willetts will make the case for higher capital taxes on Britain’s record levels of wealth, including a long overdue reform of council tax and inheritance tax.

On council tax he will cite the inequity of the proportional tax rate for a family living in a £100,000 house being five times that of someone living in a £1 million pound property, saying:

“Yes, some should pay more. But there are ways to help asset-rich, low-income older families, for example through deferred payments. And those with the lowest incomes would pay less, as will younger people who don’t own their own homes.

He will call on all politicians to face up to these difficult and unpalatable questions on tax because the alternatives are far worse. He will say:

For many years, higher wealth taxation has been off the political agenda.

“But unless we act, at some point we will face a choice between changing our approach to taxation, or cutting access to the NHS and letting social care get into an even deeper crisis. We can’t delay that debate any longer.”

He will say that the argument for greater capital taxation as a means to share the cost of rising welfare spending across all generations can be won, and conclude by saying:

“My parents’ generation bequeathed the creation of the modern welfare state six decades ago. The gift to my children’s generation – and those that follow – should be a fair funding settlement that all contribute to, for a modern welfare state that supports young, old and those in between over the next 60 years.”

Notes to Editors

  • The Foundation’s tax rise figures are based on the OBRs projected gap in spend and revenues by 2040 from their Fiscal Sustainability Report. That extra spend in today’s terms is the equivalent of £60bn, or 15p increase in basic rate of income tax.

The post Baby boomers face a choice between higher capital taxes or lower take home pay for our children, warns Lord Willetts appeared first on Resolution Foundation.

A welfare generation: lifetime welfare transfers between generations

$
0
0

This research paper looks at what people put in and take out from the welfare state over their lifetime, updating John Hills’ seminal research on life-cycle welfare transfers between generations. It estimates the extent to which past and future cohorts contribute to the welfare state via taxation and withdraw from its core pillars – education, health and social security – over the course of their lifetimes. It finds that successive generations have received more from Britain’s welfare system than they have paid in, with baby boomers gaining the most so far and the pre-war ‘silent generation’ gaining the least.

The UK welfare system runs on a ‘pay as you go’ basis, with workers contributing to fund support for children, pensioners and those in need. If longevity, cohort size and levels of tax and spend remained the same across time, then, with an annual balanced budget, successive cohorts would put in precisely what they take out. Of course in reality that is not the case, and variation in each of those factors shapes the extent to which different cohorts as a whole are net withdrawers from the welfare state over their lifetimes.

The post A welfare generation: lifetime welfare transfers between generations appeared first on Resolution Foundation.

Two housing crises

$
0
0

We occasionally host guest blogs on important controversies and here, Ian Mulheirn responds to a blog last year by Kate Barker and Neal Hudson. Resolution Foundation’s latest housing report Home Affront is available here. We will shortly be publishing a housing policy paper as part of our Intergenerational Commission.


At a time when politics has rarely been more divided, one major policy issue is a matter of cross-party consensus: we have a housing crisis. House prices were broadly unchanged from the mid-70s to the mid-90s, but have since exploded, rising by around 160% in real terms in just over 20 years. Almost everyone, from the Prime Minister down, agrees that ‘decades of undersupply’ are to blame for stratospheric prices.

Yet since house prices began their vertiginous ascent, new housing supply has comfortably outpaced household formation for England as a whole. As a result, while there were 660,000 more houses than households in 1996, that surplus had almost doubled to 1.25 million by March last year.

A growing surplus of houses isn’t, on its own, conclusive proof that there is no housing shortage. But these figures should make us question the conventional wisdom that high house prices are the result of a lack of places to live. I’ve been doing that over the past year, in a series of blogs looking at a range of evidence about what’s happening in the housing market.

Whenever those striking national surplus figures are pointed out, two important challenges are invariably raised. One is a story about how the housing shortage is really a local phenomenon, so national figures aren’t informative. The second is that supply may only have outstripped household formation because declining affordability has prevented many people setting up on their own.

In this blog I explore the evidence on both of these, showing that on both counts the data suggest that the rate of new housing supply has been more than sufficient for many years. Rather, the problems we see in the housing market are the product of two separate ‘crises’ neither or which can be solved by building more. I conclude by offering a framework for thinking about the different types of evidence that tend to be used in debates about the adequacy of housing supply.

The geography critique

The geography critique suggests that while we might not have a shortage nationally, we’ve not been building enough in parts of the country where people increasingly want to live. London, with its rocketing house prices, springs to mind — up almost 50% in since January 2013 alone, and a staggering 330% on 1996, adjusting for inflation. In the capital, if anywhere, there must be a housing shortage.

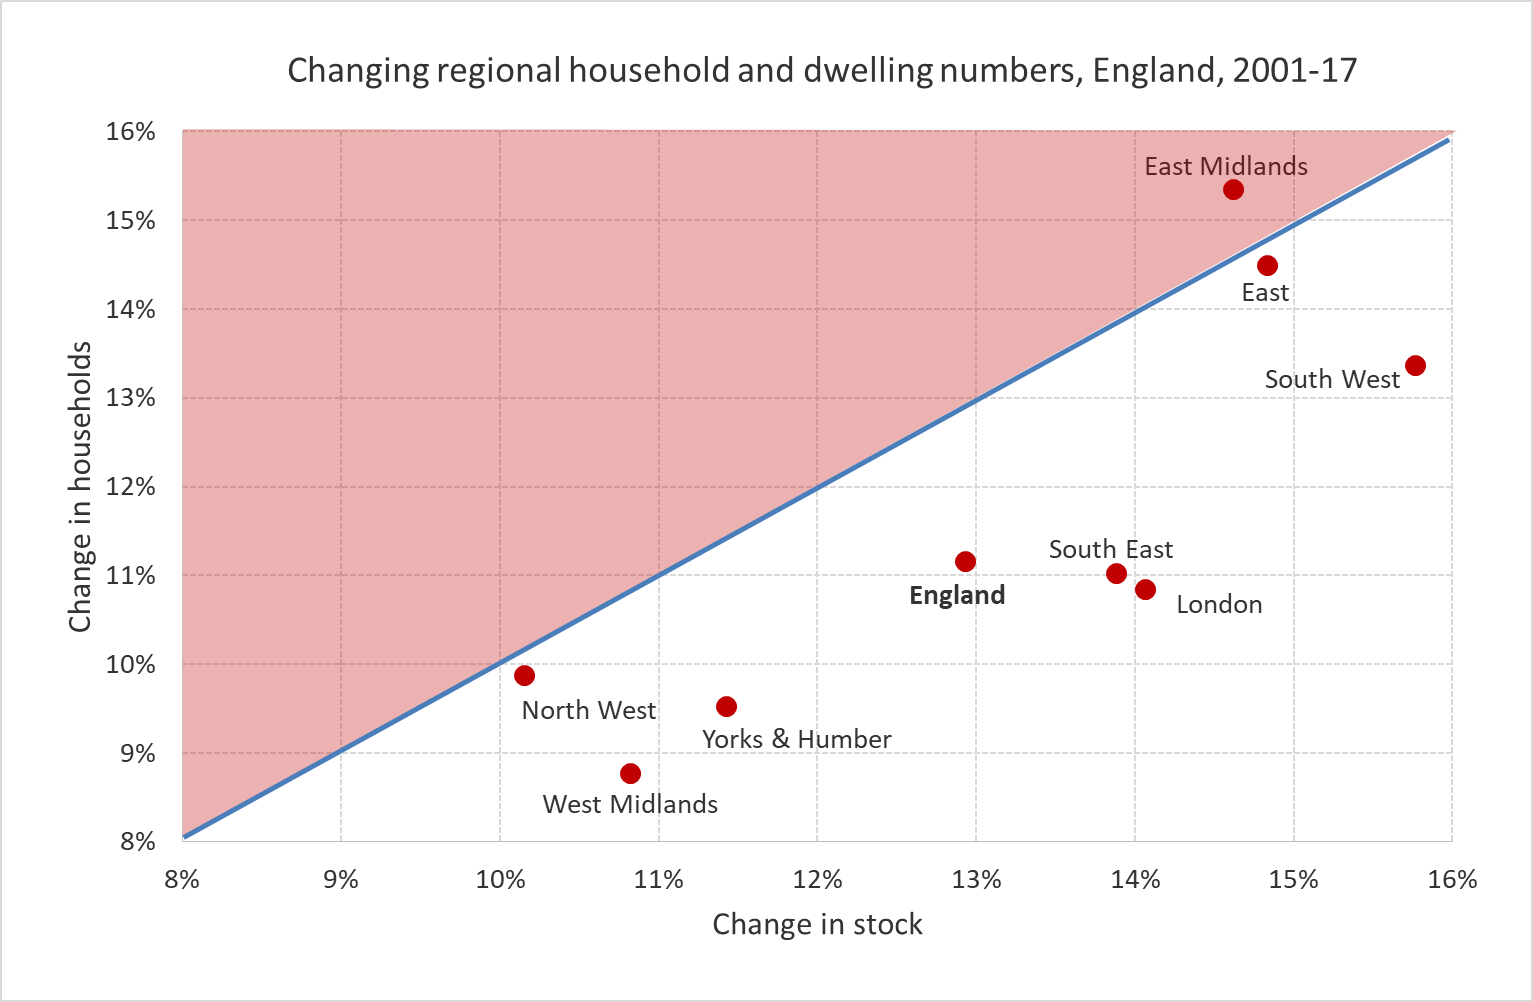
In fact, London and the South East have done reasonably well on housing supply in recent years, adding about 14% more houses but only 11% more households since 2001. The chart below plots the change in households against the change in housing stock for each region of England. Anything in the red zone, north of the 45-degree line, would be a region where stock has grown slower than the number of households — the red-shaded ‘supply shortage’ zone — while anything below it is in the ‘growing surplus’ zone. Regions representing two thirds of English households are comfortably in the ‘growing surplus’ zone. Three regions sit close to the line, suggesting supply has broadly kept pace, with only one of those creeping into the ‘supply shortage’ zone. Not much evidence of a local shortage story here.

The affordability critique

As I’ve pointed out before, despite this apparently benign picture we can’t look at housing volumes alone to determine whether supply has been adequate. This is also something that Kate Barker and Neal Hudson raised in a blog for the Resolution Foundation late last year. What if growing numbers of second homes, Airbnb, and buy-to-hold investors are taking large chunks of that supply out of circulation for residents? If so, the effective supply may be less healthy than the raw volumes data suggest. As a result, the cost of housing could be pushed up, choking off the rate of new household formation as people struggle to afford the costs.

Tracking changes in average housing affordability is therefore the best metric we have of whether housing supply has been growing at an adequate rate. If effective supply is increasingly constrained, we should see that reflected in the cost of housing taking up a growing chunk of household incomes — and hence falling average affordability.

The appropriate measure of housing costs is obviously rent, for renters. But the ‘rental equivalent’ that would be charged on an owner occupier’s house is also the appropriate measure of the cost of owning a house. (For more on why so-called ‘rental equivalence’ is a good way to measure housing costs for owner occupiers, see here and here.) So we can use the ONS’s Index of Private Housing Rental Prices, which tracks rents over time on a like-for-like basis, as a barometer for housing costs in both the private rented and owner occupied sectors.

Kate and Neal show that on this measure rent has outpaced average earnings since decent data started to be collected in 2005. But earnings is the wrong measure. ONS’s Average Weekly Earnings (AWE) measures the average across those individuals in work. This is no use if we want to assess average affordability for households. Instead we need to use a measure of disposable household income. Such measures capture effects like the rise of employment and self-employment rates to record levels in recent years, growing pensioner incomes, and changes to taxes and benefits.

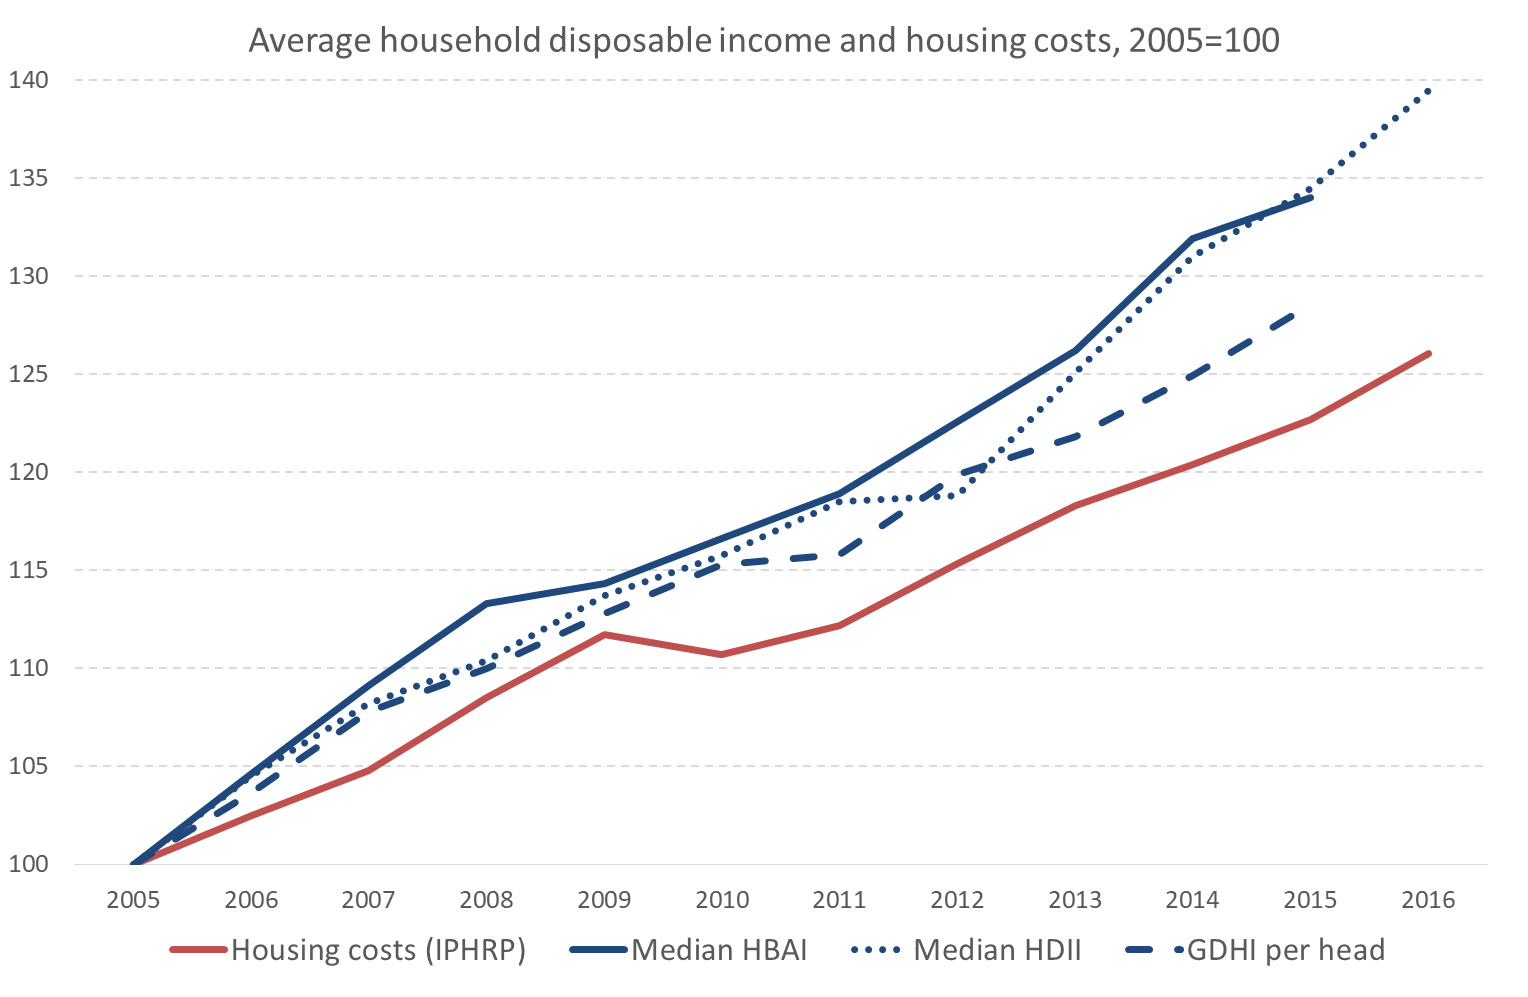
The chart below shows how housing costs have evolved in comparison with three official measures of household disposable income since 2005. One is DWP’s household income measure, known as Households Below Average Incomes (HBAI). The second is the ONS’s Household Disposable Income and Inequality dataset. The third is a national accounts-based measure of the same thing – Gross Household Disposable Income (on a per-head basis). Each measure has its strengths and weaknesses, but all three show a consistent story: since 2005 average household incomes have comfortably outstripped housing costs.

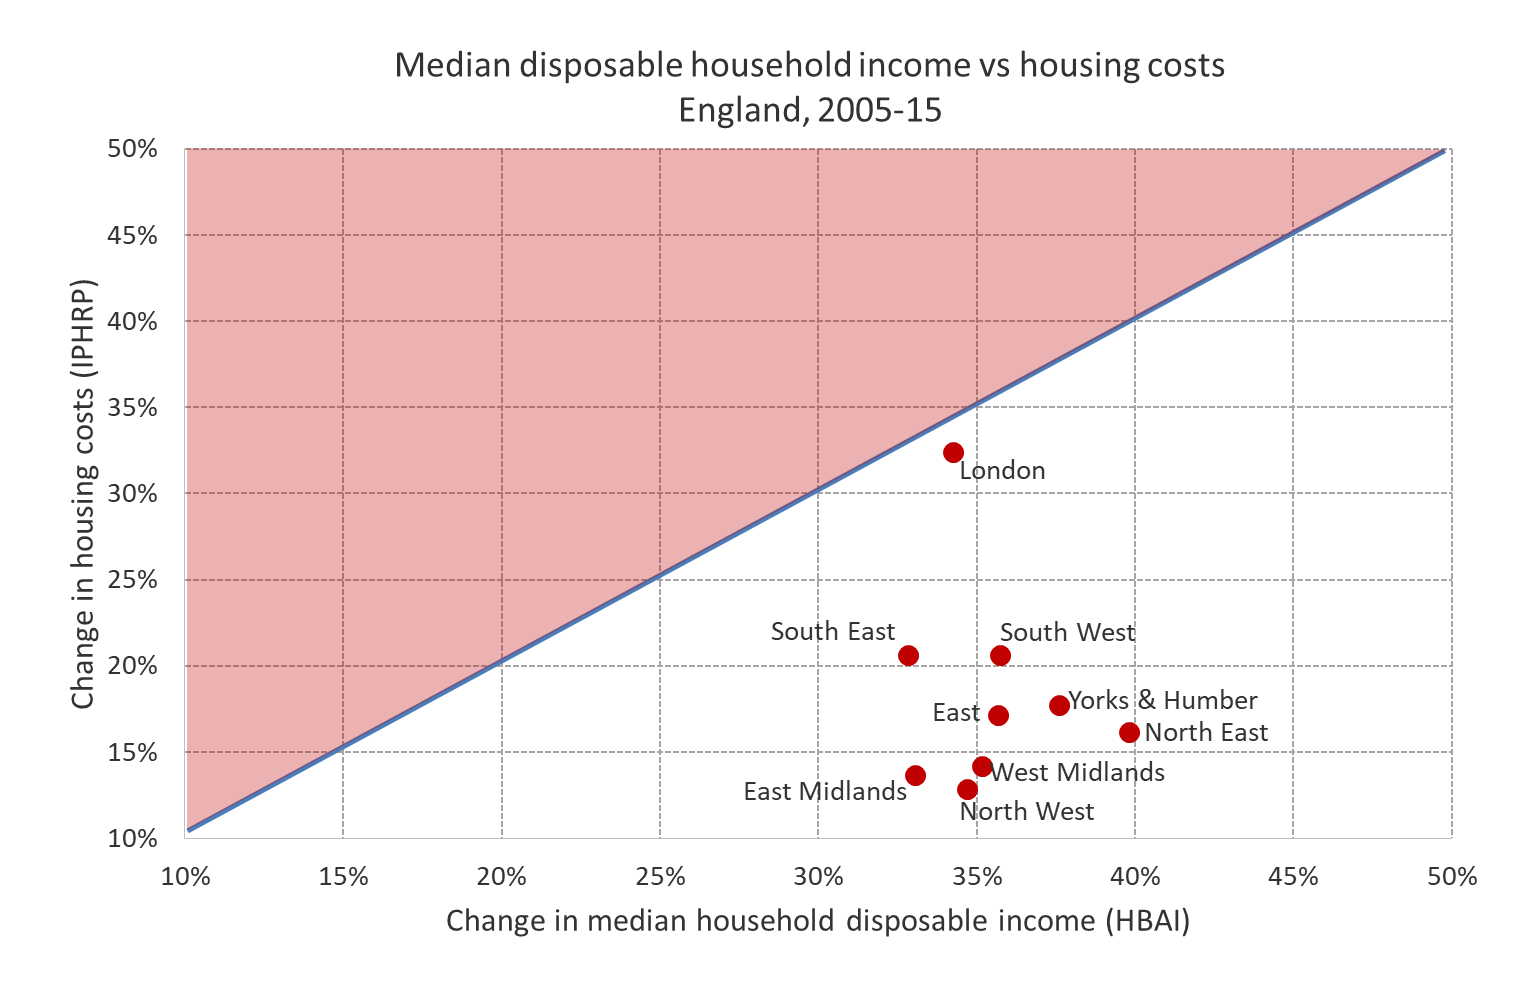
Regionally, too, average affordability seems to have improved in recent years. In the chart below, again, anything in the red ‘supply shortage’ zone is a region where housing costs have risen faster than average disposable income over the period, while any region below it has enjoyed housing costs that are — on average — taking up a diminishing portion of the average household’s disposable income.

Using the regional HBAI measure, it shows that there are no regions in England where housing costs have grown faster than average household income over this 11-year period. The one arguable exception to this improving picture is London, where housing costs appear to have tracked average income over the period. A higher rate of new supply here might help to bear down on costs, but there’s nothing here to suggest that London has seen a worsening housing shortage over this period.

All of this is, of course, exactly what we’d expect to see happening to housing costs in the wake of a growing surplus of dwellings over the past 25 years. Over the period for which we have decent data, we can see that average affordability of housing has been improving – even though house prices have rocketed. Hence we can be confident that a shortage of houses has not been the cause of our house price woes over the past quarter of a century. As Simon Wren Lewis and I have argued, blame for that lies squarely with low interest rates, mortgage regulation and foreign investors taking a shine to London property.

A framework for thinking about evidence in housing

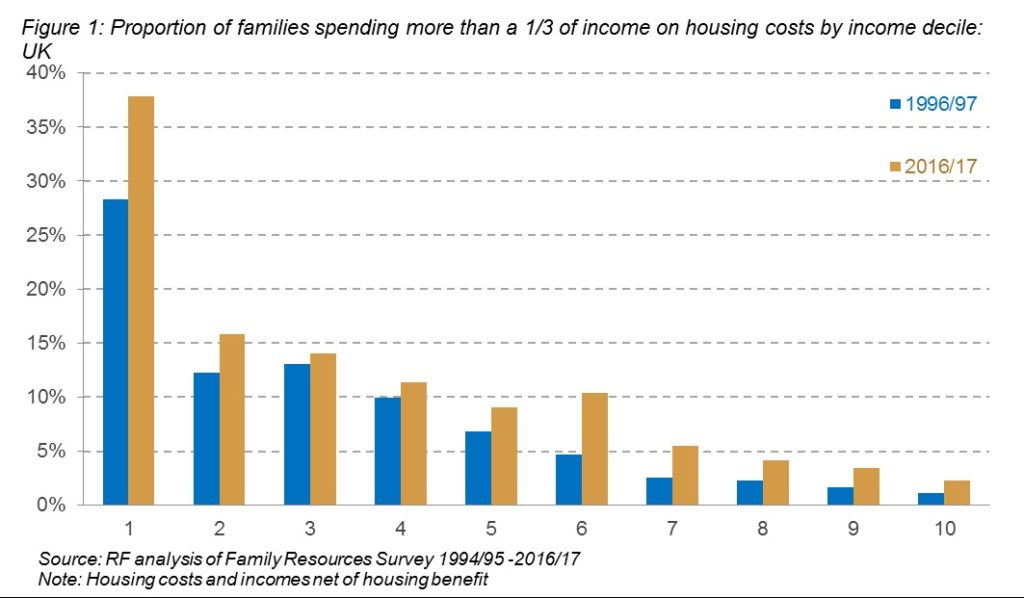
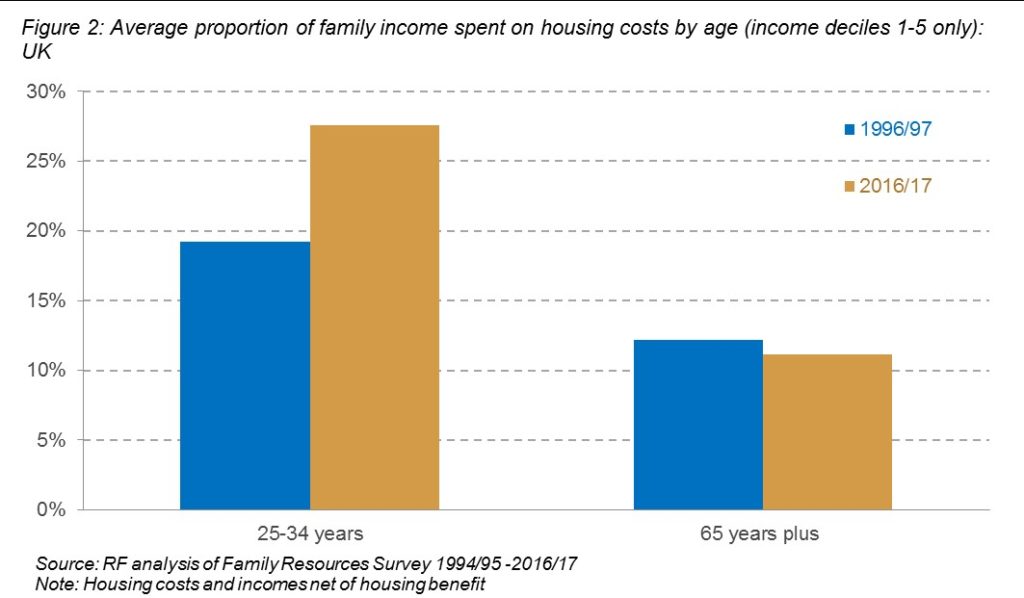
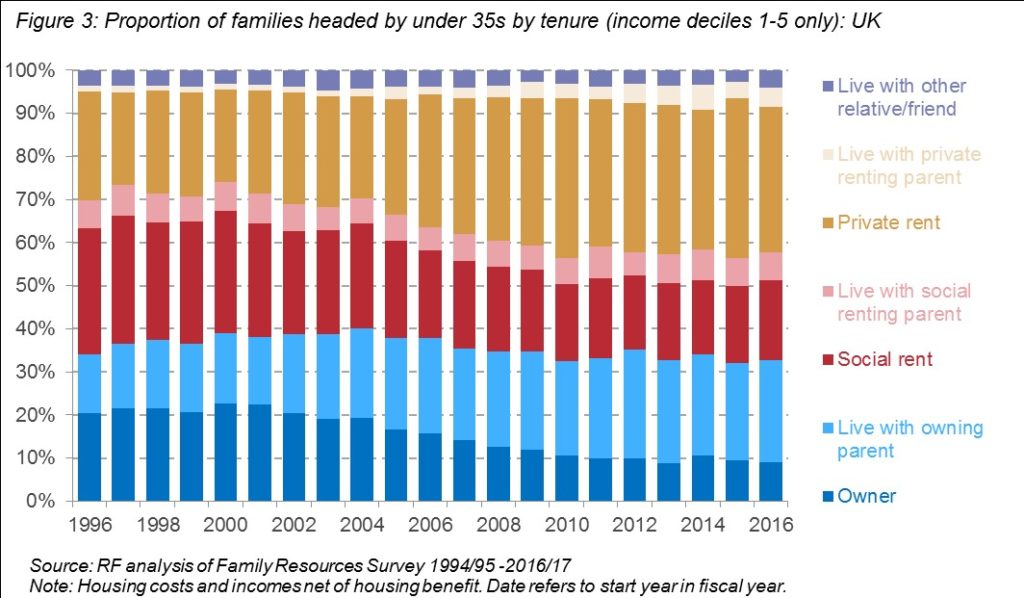
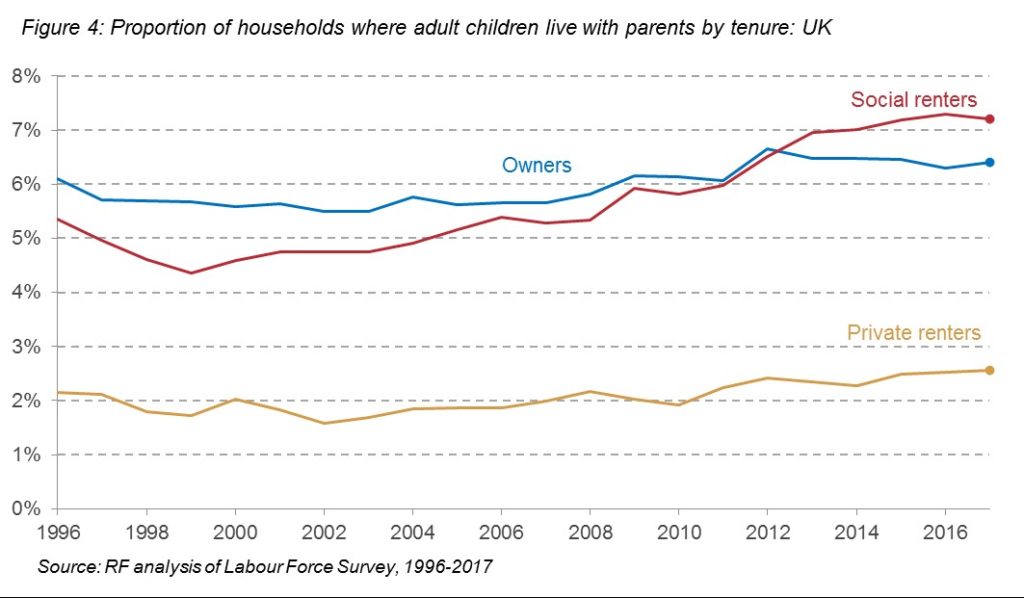
None of this is to deny that housing affordability has undoubtedly declined in recent years for some people. For example, affordability for young people fell sharply in the years after the financial crisis as their wages took a hit. Chris Giles cites the Resolution Foundation’s work showing how out-of-pocket housing costs for Millennials take a bigger chunk of their incomes than was the case for Generation X. And in their blog, Kate and Neal go on to cite comparable evidence, including data showing larger numbers of young people living at home, and a rise in homelessness. Other factors have also been at play, with many households facing cuts to housing benefits and other transfers that directly reduce housing affordability. James Gleeson documents a rise in the number of concealed households.

All the evidence cited in these pieces is accurate. Some of it suggests that there may have been a rise in the number of would-be households that haven’t formed. So how can these insights be reconciled with the aggregate evidence above that housing supply has been improving for the past 25 years?

Housing costs as a proportion of some people’s incomes can rise either because housing costs have risen relative to average incomes — indicative of a shortage — or because some people’s incomes have fallen — suggesting that the problems lie instead in the changing distribution of income.

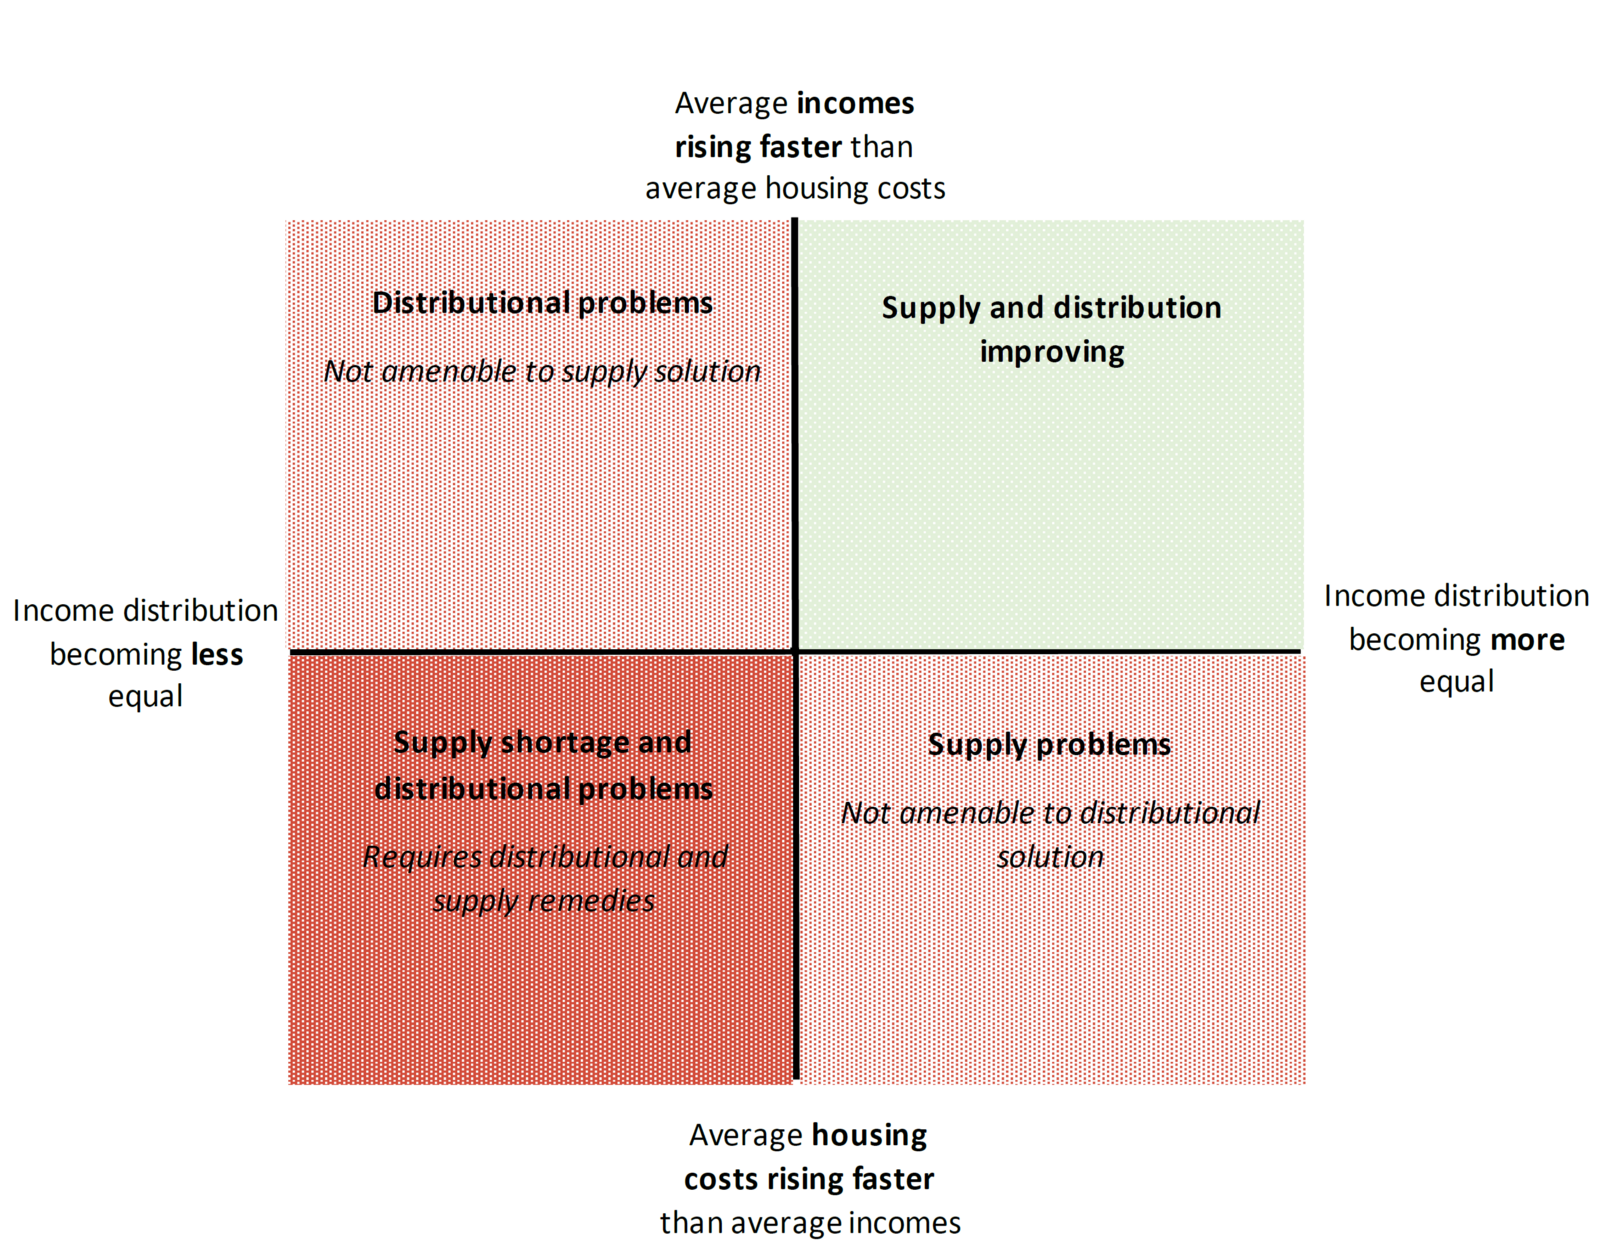
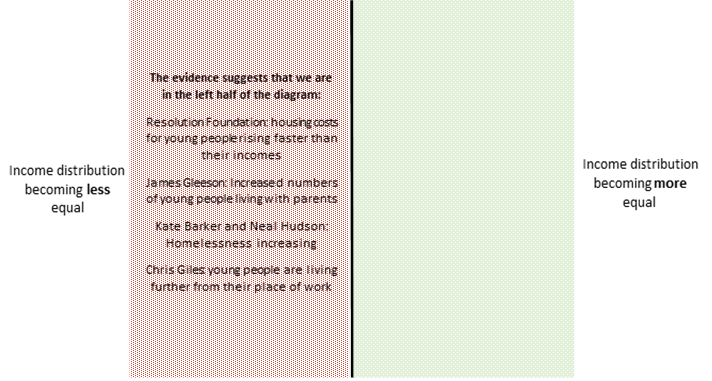
This suggests a framework for thinking about housing evidence, illustrated by the diagram below.

  • The vertical axis measures the degree to which housing costs are rising or falling as a proportion of average incomes. Data that locates a region below the horizontal line suggests it has a worsening housing shortage, while anything above it has an improving supply situation since housing is getting more affordable.
  • The horizontal axis captures changes in the income distribution. A region located on the right hand side would be characterised by falling income inequality, and falling numbers of suppressed households.

The data showing that rents have risen as a share of younger people’s incomes, suggests that the country as a whole sits on the left of the chart: there is a problem for some groups that’s showing up in housing.

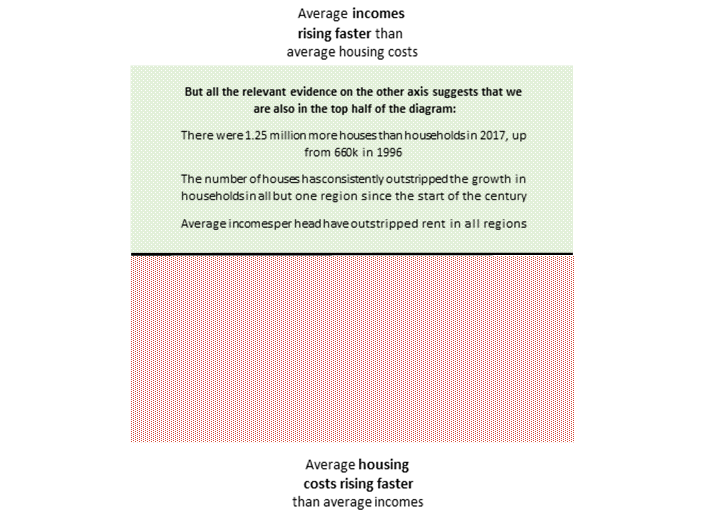
But this evidence for specific groups cannot tell us whether it’s a crisis caused by a shortage of supply or something else, which is affecting the incomes of those groups. In other words it can’t tell us whether the country is in the top or the bottom half of the diagram. To determine that, we can only use aggregate data and averages.

What the housing affordability (and, less directly, households-versus-stock) data tell us is that, with the possible exception of London, the country sits in the top half of the diagram.

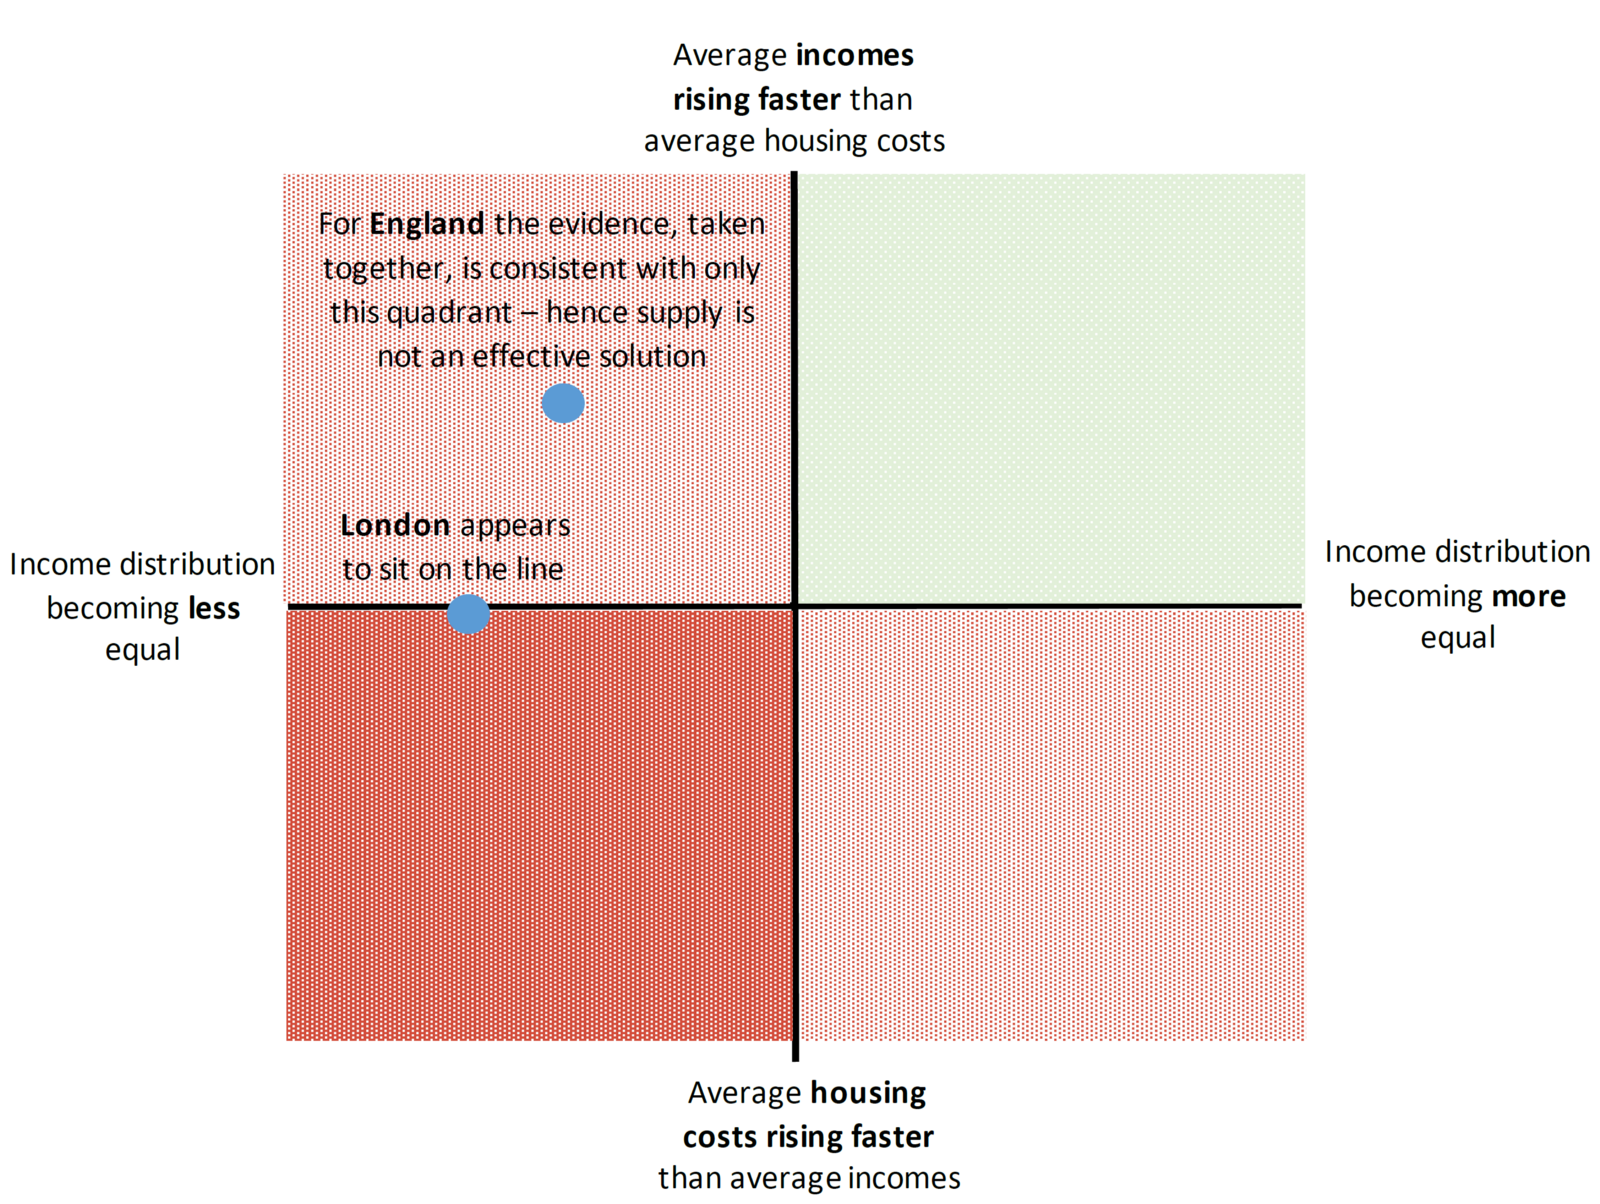
So it’s entirely possible to reconcile both bodies of evidence. England as a whole sits in the top left quadrant: supply has been steadily improving housing affordability on average, despite affordability problems for some caused by worsening distributional factors like weak pay growth and benefit cuts. The one regional exception appears to be London, where average housing affordability appears to be unchanged in recent years. This suggests that London has neither improved nor deteriorated in terms of supply.

Rather than one housing crisis caused by ‘decades of undersupply’, then, we in fact face two distinct housing crises: deteriorating affordability for some due to adverse trends in their incomes, and high prices caused by financial conditions.

It’s true that greater supply would reduce rents and prices marginally. But most academic work on the subject tells us that no plausible amount of building will have a material impact on either problem. Oversimplifying our housing problems is leading policymakers down a blind alley – only when we grasp the real causes will we have a chance of solving the housing crises.

The post Two housing crises appeared first on Resolution Foundation.

Home improvements: The role of housing policy in renewing the intergenerational contract

$
0
0

The last decade has seen housing at last work its way to the top of the political agenda. From much lower home ownership and higher housing costs for younger generations, to the sharp increase in families living in less secure rented accommodation, there is now a cross party consensus that Britain faces some serious questions on housing.

But now comes the hard bit – does Britain have any housing answers? What policies might make a difference to home ownership? What can be done more immediately to provide more security for those bringing up children in the private rental sector? And how can politics step up to the depth and breadth of our housing crisis?

At an event at its Westminster headquarters the Resolution Foundation presented new analysis and policy proposals prepared for the soon to report Intergenerational Commission. A panel of experts including the  Intergenerational Commissioner Kate Barker and CEO of Get Living housing  provider Neil Young debated possible policy solutions to the housing crisis, before taking part in an audience Q&A.

The post Home improvements: The role of housing policy in renewing the intergenerational contract appeared first on Resolution Foundation.

Home improvements: action to address the housing challenges faced by young people

$
0
0

As the Resolution Foundation’s Intergenerational Commission enters its final stages, this report sets out our view on how we can tackle one of the biggest issues for young people in 21st century Britain: the housing crisis. Here, we move beyond a diagnosis of the problem and instead set out a series of policy options relating to three key areas of our housing challenge: insecurity in the private rented sector, falling home ownership rates for young people and a long-term lack of house building.

The post Home improvements: action to address the housing challenges faced by young people appeared first on Resolution Foundation.

The future fiscal cost of ‘Generation Rent’

$
0
0

The future fiscal cost of ‘Generation Rent’

For most people the lion’s share of their income is spent housing and so forking out on accommodation when no longer earning would seem like a tall order for many. The vast majority of retired people own their own home and so have relatively low housing costs, however a significant minority (around 23 per cent) rent and many of these people have some or all of their housing costs paid by the state.

Housing benefit helps those in private and social rented accommodation. People who own their own home and those who have assets worth more than £16,000, and who are not eligible for Pension Credit, do not receive housing benefit. Furthermore, those in institutional accommodation (care homes) also do not qualify. Last year 1.3 million pensioners claimed housing benefit, amounting to £6.3 billion.

How much we’ll have to spend on housing benefit for those in retirement in future depends on a number of things, including the size of the pensioner population, their income, and what type of accommodation they live in. So far most analysis has focused on the impact that an ageing population could have on the housing benefit bill. The Department for Work and Pensions and the Office for Budget Responsibility’s own analysis, last carried out in early 2017, suggests that an older population will mean more pensioners claiming housing benefit, but that spending will fall as a proportion of GDP. However – aside from some analysis by the Strategic Society Centre – less attention has been paid to the possible impact of changing tenure patterns. Indeed the government’s own analysis assumes that the tenure patterns of the future pensioners will be much the same as for the current generation.

However, previous work for the Intergenerational Commission has suggested that this may not be the case. Younger generations are finding it a lot harder to get on the housing ladder and it is uncertain if the low homeownership rates for younger people will be reversed over the next decade, even if some of these people will inherit property wealth from their parents. Our estimates suggest that if recent conditions persist as few as 47 per cent of millennials (those born between 1981 and 2000) may own their own home by the time they reach 45. Some of the remaining 53 per cent may inherit property wealth that they can use to get on the housing ladder, but even under relatively optimistic assumptions this is only likely to increase homeownership rates in retirement to around 66 per cent. Now of course we could instead see a return to economic conditions similar to those that existed when it was a lot easier to purchase one’s home, but even under this (extremely) optimistic assumption it is unlikely that homeownership for millennials will reach the rate (77 per cent) for current retirees.

To get a sense of the possible impact that different tenure patterns could have on the pensioner housing benefit bill we have used our projections for housing tenure over the next decade, with our estimates of the possible impact of inheritances, along with official population forecasts to estimate the bill in 2060, a point when the vast majority of millennials will be in retirement.

Our results are expressed in today’s spending terms because we are estimating how the housing benefit bill would change if everything but population and tenure were held constant. We take no view on whether or not the generosity of housing benefit will change, or whether more people will be housed institutionally, we are also not forecasting how the economy and pensioner incomes will evolve over the next four decades (a full explanation of our methodology is provided in a link at the bottom).

The results are provided below. The optimistic scenarios are based on the assumption that 73 per cent of millennials will own their own home in retirement, the pessimistic scenarios assume that just 66 per cent will. The fifth and sixth rows strip out the impact that an ageing population has, while the seventh row isolates the impact of demographic changes by holding tenure constant.

A few things stand out. The first is that the ageing of the population has a significant impact, raising spending on housing benefit by approximately 70 per cent. However, our pessimistic scenario shows that, stripping out the impact of an ageing population, tenure changes will still raise the housing benefit bill by around 50 per cent. A similar magnitude as that caused by the demographic shifts.

The above should provide a sense of the impact that a rise in the share of pensioners renting in retirement could have on public spending. Though our estimates are only illustrative it is worth pointing out that a number of factors could boost or shrink these numbers. First, we assume a relatively high proportion of pensioners (18 per cent) rent in the social sector. Current trends suggest that an increasingly small share of millennials rent socially, and should a higher proportion of pensioners rent privately in retirement then this would – under current policy – push costs up. On the other hand, we do not take account of the fact that – in a world in which the proportion of pensioners renting is far higher – the marginal ‘renting’ pensioner is likely to be wealthier and so perhaps qualify for less housing benefit. There are clearly both upside and downside risks to our estimate.

Although their results are produced using a different methodology (which amongst other things estimates how pensioner incomes and GDP will evolve over the next four decades) we can compare our estimates of the number of pensioners claiming housing benefit in 2060 to those produced by the OBR and DWP. Their assessment assumes little change to current tenure patterns and they estimate that 1.6 million pensioners will be claiming housing benefit in 2060. This compares to our assessment of 2.6 million under our optimistic scenario and 3.3 million under our pessimistic scenario. Inflating their figure to take into account the possible impact of a decline in homeownership suggests that around 2.2 million pensioners may end up claiming, which – although less than our estimate – still provides some indication of the impact that a fall in homeownership could have.

Predictions, not least those that attempt to peer forty years into the future, should always be taken with a pinch of salt. However, this exercise has drawn attention to something that has not been adequately included in discussions of the fiscal impact of an ageing population. The more older people who rent their homes, particularly in the private rented sector, the higher spending on housing benefit will likely need to be to support these people. We have documented how renting in the private rented sector often involves paying more, getting lower-quality accommodation, and enjoying less secure tenure, this analysis suggests that it may also cost the state a lot more in future.

Full methodology document can be accessed here

The post The future fiscal cost of ‘Generation Rent’ appeared first on Resolution Foundation.

The real barrier to millennials owning a home is not the mortgage – it’s the deposit

$
0
0

Has the heat finally gone out of the housing market? New data from the Nationwide published this week suggested it might just have, with the cost of the average home falling by more than 3 per cent in the last month. But before aspirant home buyers start putting out the flags, it’s worth setting this change into the longer term context.

Since 2000, house prices have risen more than 250 per cent in the UK, greatly outpacing earnings which have grown by just 68 per cent over the same period of time. Small surprise, then, that today’s young people are just half as likely to own their home at the age of 30 as the baby boomers were at the same point in their lives.

This stark generational fall in ownership is not explained by the costs of servicing a mortgage however – in fact, today’s low interest rate environment means that many young people who buy a home have a far easier time than previous generations in this respect. Deposits are the real contemporary challenge. In the 1990s it took the average young family just 3 years to save for a reasonable sized deposit; today it would take the same family 19 years to accrue the amount they need.

As a result, the ‘bank of mum and dad’ has become an increasingly important source of support for first-time buyers. A lucky 35 per cent of new purchasers had help from family or friends with a deposit in 2016/17, and 1 in 10 used an inheritance to fund the deposit. But where does that leave the many young people who don’t have family resources to fall back upon, either now on in the future?

Without reform, the prospects for these young people look bleak. For many, the only option will be to rent privately for most – if not all – of their lives. But as Generation Rent grows up, the tenure looks increasingly unfit for purpose. The growing number of families with children renting privately – up from just 600,000 in the early 2000s to 1.8 million today – has lead many (including ourselves) to call for greater security of tenure for renters today.

Even with such a change, however, home ownership is likely to remain an enduring ambition, not least because it allows families to build up an asset over time. So what more could be done to help those who cannot overcome the barriers to entry?

This week we put forward a radical proposal that every young person should receive a ‘Citizen’s Inheritance’ of £10,000 at the age of 25. These funds would be restricted use: they could cover the costs of education and training, be put in a pension pot, or critically be used to buy a home. This amount would go a long way to help, covering 40 per cent of the average first time buyer’s deposit in the UK today.

However, the boldness of the proposal lies as much with its source of funding as with the giveaway. We argue that inheritance tax should be replaced by a Lifetime Receipts Tax, meaning that those lucky enough to have a ‘bank of mum and dad’ to draw down on share some of this wealth around. By shifting demand for housing rather than increasing it, inflationary pressures on house prices should be keep to a minimum (and building more homes which we call for as well would put downward pressure on prices too).

Greater security in the private rented sector and a fairer level of support with home ownership: unlike a one-month fall in house prices, that really is something worth cheering about.

This post originally appeared in the i

The post The real barrier to millennials owning a home is not the mortgage – it’s the deposit appeared first on Resolution Foundation.


Wealth across Scotland has broken the £1 trillion barrier and should play a bigger part in Holyrood debates

$
0
0

Scotland’s household wealth has exceeded £1 trillion for the first time, according to a new report published today (Friday) by the Resolution Foundation.

The report ­– The £1 trillion pie: how wealth is shared across Scotland – looks at both the scale of assets in 21st Century Scotland and who holds them. It says that wealth is playing a bigger role in shaping Scottish society, and calls for a greater focus on wealth in political debates to reflect this shift.

Typical Scottish wealth now totals £237,000 per household, compared to £259,000 for Great Britain as a whole. Pensions, rather than housing, play a bigger role north of the border, with more than half of household assets accounted for by pension savings, compared to 42 per cent across Britain.

Typical pension wealth in Scotland is just under £70,000 (compared to £58,000 in Britain), while typical property wealth in Scotland is £65,000 (compared to £95,000 in Britain).

The report highlights five reasons why policy makers should pay more attention to wealth in the years ahead:

Wealth has grown much faster than incomes: Scottish wealth has grown from being five times GDP to more than seven times over the last decade. This has made it much harder to close wealth gaps by earning and saving. It would now take a very high income family (in the top 10 per cent of households with a £58,000 income) 19 years of saving every single penny they earn to become a truly wealthy family (in the top 10 per cent wealthiest households with assets of over £1 million).

Generational divides have opened up: Recent wealth booms have largely benefitted older generations, with no cohort born since 1965 seeing higher wealth than their predecessors at the same age. At age 35, those born in the second half of the 1970s had one third less wealth than those born just five years before (£33,000 vs £52,000) This is in part because of big falls in home ownership rates for young adults in Scotland, which have fallen from 48 per cent in 2003 to 32 per cent today.

Inheritances are booming: what you inherit, rather than what you earn, is set to become much more important determinant of your lifetime living standards in the years ahead. Inheritance tax revenue raised from Scottish estates rose by 30 per cent in just two years up to 2014-15.

Wealth is very unequal: wealth in Scotland is nearly twice as unequally held as income. 25 per cent of Scottish people have less than £500 of net savings, compared to 22 per cent across the UK. 7 per cent have zero savings or have negative balances in their current accounts.

The biggest wealth tax is devolved: while wealth has grown in recent years, the same is not true of wealth taxation that across the UK has remained largely flat at 2.5 per cent of GDP for the last 50 years. While some wealth taxes are set in Westminster, including inheritance tax, the biggest wealth tax (Council Tax) is fully devolved. Recent modest reforms have improved council tax in Scotland, in marked contrast to the lack of progress in England, but the tax could still be much more closely tied to property values. 

Torsten Bell, Director of the Resolution Foundation, said:

“Wealth in Scotland has grown fast in recent years and will come to play a bigger role in determining life chances in the decades to come.

“This increase in wealth across Scotland has sat alongside falling home ownership rates, particularly for young families, who are struggling to accumulate wealth as preceding generations have been able to.

“The accumulation, distribution and taxation of wealth should be at the centre of policy debates in Scotland in the years ahead. If current trends continue it will become much harder in modern Scotland to earn your way to being truly wealthy, and young people’s prospects will depend less on their ability, and more on whether or not they inherit assets from relatives.”

The post Wealth across Scotland has broken the £1 trillion barrier and should play a bigger part in Holyrood debates appeared first on Resolution Foundation.

Housing stress is up – and has shifted. Our debate on social housing needs to keep up

$
0
0

It’s a year on from Grenfell, a tragedy that has taught everyone that social housing has to return to its proper place in national debate. There’s been good progress on this front already: there are fora that give a voice to those living in social rented homes; projects which seek to define the purpose of social housing in the 21st century; and a commission asking how the sector can best address the challenges of today and tomorrow. Crucially, the tide also appears to have turned on social housing funding, with government commitments last year to build more homes for social rent, backed up by real money.

This debate is good for the social housing sector, providing the opportunity to turn outward after some years of internal disagreement. It offers the chance to remind everyone of the unique social purpose that underpins this proud movement. But what is the nature of housing need in Britain today? The answer is complex, varying by class, place, age and many other factors. We start with two key pieces of evidence.

The first is that housing costs weigh more heavily of families’ living standards than they have in the past. This is felt most acutely by those on low incomes, but it is spreading to families on middle incomes too. Figure 1 illustrates the point by showing the share of families in each income decile who are ‘housing stressed’ (spending more than a third of their income on housing, even after housing benefit has been taken into account). Today, nearly four in ten families in the lowest income decile spend an unaffordable amount on housing. While some studies suggest incomes are likely to be understated at the bottom of the income distribution, the scale of the increase stands out. Even more striking is the rising level of housing stress in families across the next five income deciles. Weak income growth and housing cost pressures leave one in ten of these families in housing stress.

Second, young people are at the sharpest end of the housing crisis. Figure 2 shows the average share of income spent on housing costs by young and older families in the bottom half of the income distribution. As this makes plain, 25 to 34 year olds are spending a high proportion of income on housing, and have seen the biggest increase in their housing burden over time. Poorer pensioners have actually seen slight declines in their housing cost to income ratio in the last 20 years.

So, housing pressure is felt most keenly by young, lower income people. But the social housing sector has not been able to respond to this major shift in need. Indeed the opposite has happened: these families are less likely to live in the social rented sector than in the past (which is one driver of the higher housing stress shown above). Acres of press coverage have been devoted to the dramatic falls in home ownership for the young. But the fact that young, lower income families have seen as big a fall in rates of social housing as they have in home ownership – both have fallen by 11 percentage points in the last 20 years – is never mentioned (see Figure 3).

Housing pressures also mean that more under 35s are living at home with their parents today than were in the past. As Figure 3 shows, a similar proportion of young people today live in a home their family owns – it’s just much less likely they will have their name on the deeds. While the increase is bigger in absolute terms among home owning parents, what is increasingly clear is that many more young adults are only able to access the social rented sector by remaining at home with their parents. In fact, as Figure 4 shows, there is now a higher chance that a social renting household will include an adult child (or children) than an owner occupied one.

To some extent these trends are an obvious function of the decades-long contraction of the social rented sector. Indeed, older people have been affected by this too with a major decline in the proportion of over-65s housed in the sector. But as Figure 5 makes clear, this drop is far less concerning given that in the last 20 years cohorts moving into older age have much higher home ownership rates than their predecessors, in part because they were big beneficiaries of the introduction of Right to Buy. More generally, the over 65s have seen falling housing costs relative to income in the last two decades, with the social sector doing a good job for older pensioners who are much more likely to be on low incomes than recent retirees.

It is a well known fact that as the social housing stock has fallen, a residualisation into housing lower income families has taken place. Over 80 per cent of those in the social sector are now in the bottom half of the income distribution, compared to just over 60 per cent in the 1960s (Figure 6). But when reflecting on the match between shifts in where housing need lies and what the sector is able to provide today, it is important to note that this shrinking towards the bottom of the income distribution has happened as housing stress has spread up the distribution.

Of course these are national trends and the sector will find different answers to housing needs in different places. In Stoke that might mean a focus on regeneration and employment support, while in London responding to surging housing need while protecting mixed communities and providing stable and high quality renting options are more likely to be the priorities.

These differences should not be the tensions within the sector they sometime become – they are instead signs of the strength of a not for profit sector responding to its founding mission of addressing housing need as it manifests itself differently across time and place.

internal rows with national championing of the value driven work the sector can do is needed, not least if it is to reflect a changing mood about the role of the social housing sector in 21st Century Britain. Government of course should step up to support that ambition, not least given their own housing commitments, and so should the rest of society.Our philanthropists could also join with a return to recognising that housing need can be best addressed by the not-for-profit movement their predecessors helped build. After all, endowing a university is nice, but building the affordable homes your town needs is something almost holy…

The post Housing stress is up – and has shifted. Our debate on social housing needs to keep up appeared first on Resolution Foundation.

How to solve the UK’s growing wealth gaps

$
0
0

This year, average wages are set to be flat. British households, meanwhile, are in the middle of a projected four-year income stagnation. And our productivity has barely risen since the 2008 financial crisis.

Pay, incomes, productivity – that all are flatlining is the defining feature of our economics and our politics today. There’s a reason calling a general election in 2017, as wages fell, was a risky choice by Theresa May.

But one economic number that we rarely discuss has been increasing for some time: wealth. The value of land, it was recently reported, has increased by 412 per cent since 1995; UK households have £12.8tn of wealth. Crucially, our wealth is growing much faster than our income. Between 1955 and the 1980s, wealth was steady at two and a half times national income. Today, it’s closer to seven.

Why does wealth growing much faster than income matter? Because it means that in 21st century Britain, it is no longer truly possible for someone to earn their way to wealth. The entry price to become one of the wealthiest 10 per cent of families is now £1.2m. A typical family, with an income of just over £28,000, obviously can’t expect to make it into that club – they’d have to bank every penny for 43 years. But even a family doing particularly well, with an income of £60,000, putting them in the top 10 per cent by annual income, would have to save everything for 20 years to reach the wealthiest 10 per cent. Or, to put it another way, they will never get there.

And that’s before the second trend – a wealth inequality tipping point. The 20th century delivered huge reductions in wealth inequality. You may have noticed there are fewer landed gentry about. By some estimates, the top 1 per cent had 70 per cent of all wealth in 1900. World Wars, progressive taxation and surging home ownership reduced that to less than 20 per cent by the 1980s. But there is no guarantee this trend will continue: property wealth is now becoming more unequally distributed with home ownership falling. That should trouble us all: inequality of wealth is almost twice as high as that of income.

If these two trends continue, only those born into money, or who marry into it, will constitute Britain’s wealthiest. That reality should alarm socialists on the left and meritocrats on the right. To paraphrase the French economist Thomas Piketty, who was born with what and who marries whom might make for a good Jane Austen novel, but it can’t be an acceptable answer to the kind of country we want to build.

What should all of this mean for politics and policy? Some of it is far from inevitable and reflects unambiguous policy failures. Building more homes and reducing incentives for people to demand second or third houses should be an immediate priority.

We also need to actively address wealth inequality by helping more people build some assets up. The success of pension auto-enrolment in enabling more women and low earners to save for retirement needs to be replicated for the self-employed. And we should revive the idea of asset-based welfare – because the state should help low-income families acquire assets, not merely subsidise their low incomes.

Inheritances, which are forecast to double over the next two decades, are crucial. Encouraging families to share that wealth around would help, so inheritance tax should be paid by recipients with an allowance, rather than by estates. Collective inheritances, such as social housing and decent infrastructure, are also a vital way to ensure that Britain has something to offer you even if your parents can’t write a cheque.

Though we can’t stop wealth playing a big role in society, we can make it pay its fair share. Wealth has more than doubled as a percentage of national income since the 1980s, but the amount of tax we collect from it has been frozen at around 4 per cent of GDP.

Poorly thought-through manifesto raids on wealth are unwise, but inaction on its taxation is not tenable given the strain on the public finances in the coming years, as Britain’s large baby boomer cohort (who hold a disproportionate amount of this wealth) move from paying taxes to receiving pensioner benefits. If wealth doesn’t take more of the strain, income or consumption taxes will have to – or our public services will deteriorate.

Wealth differences also risk bleeding into other areas of life where they do not belong. Wealth status could determine not only where you live, but the education you get, the risks you can take and the jobs you can do. Policy should aim to directly counter those pressures. And we must, at all costs, stop these wealth gaps infecting our politics by introducing further controls on election spending.

As a country, we find discussing wealth rather awkward. But that’s something our politics will have to overcome – because wealth is profoundly reshaping Britain.

This article originally appeared in The New Statesman

The post How to solve the UK’s growing wealth gaps appeared first on Resolution Foundation.

A cooling housing market won’t automatically ease cost of living pressures

$
0
0

Commenting on the latest ONS figures today (Wednesday) on house prices and the Prime Minister’s speech at the National Housing Federation, Dan Tomlinson, Policy Analyst at the Resolution Foundation, said:

“The UK’s housing market shows some signs of cooling, with growth in the house price index slowing to its lowest level since 2013. But we should be cautious about thinking this signals an imminent easing of cost of living pressures.

“This slowdown is driven almost entirely by trends in London and the South East. House price rises are still outpacing wage growth across many other parts of the country.

“There are also good and bad house price falls because what really matters is how much of a families’ incomes is devoted to housing costs. In so far as the recent slowdown reflects worries about lower income growth for British families, it is hard to see it as good news for living standards.

“The reality is that home ownership will remain far too distant a dream for many young people, who are likely to remain renting for some time. So it’s good to see the Prime Minister signalling a shift in attitudes towards renting by reforming tenancies in the private rental sector and announcing a £2bn boost to increase the supply of affordable social housing in the 2020s.

“However, far more will be needed if we are going to turn around the locking out of young families from our social housing stock.”

The post A cooling housing market won’t automatically ease cost of living pressures appeared first on Resolution Foundation.

Easing the housing headache: what the Chancellor should do in next week’s Budget

$
0
0

No doubt about it, housing is a headache for many young people today. The dramatic fall in the home ownership rates of the under-35s often produces the sharpest pangs for politicians (although as Chart 1 shows, we’ve seen a slight uptick in the proportion of young families owning in the last year or so). But there are other sources of pain as well. Just as ownership rates have collapsed, so too has the share of young people that live in social rented homes (from 22 per cent in 1981 to just 10 per cent in 2018). As a result more than one in three young families live in the private rented sector today, the least secure and lowest quality tenure of all.


Chart 1: Proportion of families headed by 25-34 year old by tenure: UK


Source: RF analysis of Family Expenditure Survey 1961-1983; Labour Force Survey 1984-2018

Couple this with the fact that millennials are spending a record share of their income on housing and it’s small wonder that Theresa May declared that “solving the housing crisis is the biggest domestic policy challenge of our generation” at conference last month. So what could the chancellor do in the Budget next week to ease the housing headache? Three things might begin to relieve the pain.


Target Help-to-Buy at those who need support

To begin, Hammond could sharpen up Help to Buy (HTB) – the government’s flagship programme designed to assist wannabe home owners under the age of 40. The HTB equity loans scheme may strengthen young people’s bargaining power and helped close to 170,000 of them buy a home since its inception in 2013. But the programme as currently conceived has a considerable deadweight. Chart 2 shows that one-quarter of those who have taken out such loans have a household income of £60,000 a year or more, compared to less than one-tenth of under-40s overall. Likewise, the government’s own evaluation suggests that over one-third of buyers with equity loans could have bought without government assistance. Reining in the programme by introducing an income cap of £60,000 per household would mean that the extra £10 billion committed to the scheme last year could be stretched to help those on middle incomes beyond the current end date of 2021.


Chart 2: Cumulative proportion of households headed by under 40s by net household income: England

Source: RF analysis of MHCLG, Help to Buy Quarterly Statistics, August 2018 and DWP, Family Resources Survey 1994-95 to 2016-17


 Increase the number of affordable homes

Second, more money to boost the numbers of sub-market homes would show the government is serious about helping renters on lower incomes. We’ll all be looking to the budget for detail on the PM’s surprise announcement last month that the government will lift the borrowing cap on councils: how much extra headroom will this really provide, for example, and when will the policy be implemented? For now, however, funding for affordable homes remains significantly below that available a decade ago (see Chart 3). An injection of an extra £1 billion a year from the chancellor would bring funding back up to 2008-2011 levels, and build an estimated 12,500 additional social rent homes each year. Sustained over time, this could offer real relief to those young families in acute housing stress who only a generation ago would have been housed in the social rented sector.


Chart 3: Affordable housing commitments over time: England


Source: RF analysis of UK Housing Review 2018


Use tax to increase private renters’ security of tenure

Third, the chancellor should do something to help the bulk of young renters who are on neither the margins of home ownership nor the cusp of social rent. He should heed the fact that Generation Rent is growing up and often raising children in homes they could potentially lose with just two months’ notice (see Chart 4). Legislating for indeterminate leases would be optimum (witness Scotland, 2017), especially given government efforts to inspire individual landlords to offer two year tenancies have proved ineffectual to date. In the meantime, however, Hammond could support institutional landlords investing in Build to Rent (BTR) developments where longer leases are the norm. Critically he could exempt the BTR sector from the stamp duty surcharge introduced in 2017, thereby incentivising the building of new homes that provide genuine security of tenure. In contrast to the proposal to exempt landlords from capital gains tax if they sell to a sitting tenant, this policy would help those private renters who most need a stable home rather than those who simply have the good luck to rent from a landlord willing to sell (and the money, of course, to avail themselves of the opportunity).

Chart 4: Proportion of households with children in owner-occupation and the PRS, England

Source: RF analysis of MHCLG, English Housing Survey, 2016-2017

Of course, one budget cannot solve a housing crisis that has been many years in the making. But with the government finally alert to the many problems that young people encounter when it comes to housing, intelligent action from the Treasury really should be on the cards. Here’s hoping that 2018 is the year when the chancellor doesn’t simply put his hand to his brow when it comes to housing, but swallows the bitter pill of tough policy choices instead.


The post Easing the housing headache: what the Chancellor should do in next week’s Budget appeared first on Resolution Foundation.

All aboard the Millennial Express – longer commutes for less pay

$
0
0

The ONS serve to uplift and depress analysts like me in equal measure. And today they served up the latter, with new figures showing that the number of people commuting for more than an hour to get into work has increased by almost a third (31 per cent) since 2011.

Longer commutes are good news for podcast makers – and for avid readers of Resolution Foundation reports – but bad news for everyone else. So on balance it’s something we should be concerned about. After all, commuting carries time and financial costs, along with wider effects on congestion and pollution. And for those with caring responsibilities, it can be a barrier to working at all. Normally, commuting long distances is a trade-off for higher pay.

Average commute times are about twice as high for those with incomes in top 25 per cent of the income distribution, compared to those in the bottom 25 per cent, once you control for control for age and cohort. But while commute times have increased since 2011, pay has not. Real earnings remain below their 2011 level, both at the median and at the higher end of the distribution (which is likely where the longest commutes are). Commuting times have therefore increased faster than pay.

Unfortunately, we know this one sided trade-off of longer commutes without the resulting pay bonus is particularly true for young people. Our Intergenerational Commission found that millennials are on track to spend 64 more hours commuting in the year they turn 40 than the baby boomers did at that age. And yet their earnings are no higher than the generation born 15 years earlier at the same age.

Figure: mean travel to work time in minutes by generations: UK

Source: RF analysis of Labour Force survey, 1992-2016

So why are we commuting more? The housing market is likely to be a culprit. Many places with the best paying jobs are also those where housing supply is most constrained. This seems to be affecting renters and owners alike; our research finds that those in different tenures have similar commuting patterns.

The trend towards longer commutes may be happening at the expense of geographic mobility too. Regional job-to-job moves have fallen since the early 2000s. This decline in mobility has implications for wages – the typical worker would have been £2,000 better off moving region and job, compared to staying with the same employer.

Beyond the overall increase in commute times, the other key takeaway is the gender imbalance in commuting. Men, unsurprisingly, are more likely to have long commutes. In one sense, this is a shame for men (though the extra time to read our reports is a silver lining). But more seriously, because commuting is a way of accessing higher paying jobs, it is more usefully interpreted as a way in which gender imbalances in caring responsibilities feed into a gender pay gap. The IFS has showed that a gender ‘commuting gap’ opens in the years after the birth of a first child, much as the pay gap does. They note that if women face more limited job choices due to caring responsibilities, they may lose access to higher paying jobs.

Figure (ONS): Proportion of commutes of different length by men and women, UK, Oct-Dec 2017


Source: ONS

Commuting is a subject that is guaranteed to enrage people. But today’s figures show that commuter trends are even more important than rail rage and traffic jams – they provide an insight into where, and how, we work and live.

Longer commutes may be a sign that something is wrong with our housing market. And while many of us crave shorter commutes, for some groups this can be a driver of labour market disadvantage too.

The post All aboard the Millennial Express – longer commutes for less pay appeared first on Resolution Foundation.

Lender of last resort? The Bank of Mum and Dad and Britain’s millennial housing crisis

$
0
0

High house prices and weak wage growth have led to a stark fall in home ownership rates among young people since the early 2000s, with a typical first-time buyer needing 18 years to save for a deposit, up from 3 years in the mid-90s. Increasingly stepping into this gap has been the Bank of Mum and Dad.

How strong is the link now between parental wealth and their children’s home ownership prospects, and how has it changed over time? How are banks responding to this changing world? What are the wider implications of young people’s prospects being determined by the wealth of their parents and what can we do to address this?

At an event at its Westminster headquarters, the Resolution Foundation will present the key findings from new research on the direct link between parental wealth and their children’s housing prospects. A panel of experts will then discuss what this means for social mobility, for the housing market and how politics should respond to it, before taking part in an audience Q&A.

Speakers

  • Neil O’Brien – MP for Harborough, Oadby and Wigston
  • Sue Hayes, Group Managing Director – Retail Finance at Aldermore Bank
  • Steve Machin, Director of the Centre for Economic Performance at the LSE
  • Stephen Clarke, Senior Economic Analyst at the Resolution Foundation
  • Torsten Bell, Director of the Resolution Foundation

The post Lender of last resort? The Bank of Mum and Dad and Britain’s millennial housing crisis appeared first on Resolution Foundation.


House of the rising son (or daughter)

$
0
0

Homeownership rates have plummeted for today’s younger generation. Hypothetically, it would currently take a 27-30 year old first time buyer around 18 years to save for a deposit if they relied solely on savings from their own disposable income (up from three years two decades ago). Rising unaffordability has led many first-time buyers (FTBs) to rely on family or friends to help with the deposit on their first home. The rise of the so-called Bank of Mum and Dad (BOMAD) is much-discussed but until now there has been little analysis of the strength of the relationship between parental support and people’s chances of becoming homeowners.

This paper fills this gap. Using a novel dataset which connects parents and children we are able not only to analyse the association between the property wealth held by people’s parents and their own, but we are also able to strip out the impact that other factors (earnings, education, etc) have on homeownership.

The post House of the rising son (or daughter) appeared first on Resolution Foundation.

Young people with property-owning parents are now almost three times as likely to have homes of their own

$
0
0

Young people whose parents have property wealth are now almost three times as likely to be homeowners by the age of 30, compared to those whose parents have no property wealth, according to a new report published today (Tuesday) by the Resolution Foundation.

With the ‘Bank of Mum and Dad’ now considered to be a key lender for first-time buyers, House of the Rising Son (or Daughter) shows for the first time how important parental property wealth is in determining young people’s housing prospects.

The report finds that in the mid-1990s and early 2000s, home ownership rates for 30 year olds with parental property wealth were – at 40 per cent – twice that of young people whose parent did not own a home.

This gap has since grown so that recent home ownership rates for 30 year olds with parental property wealth are – at 25 per cent – almost three times that of those without parental property wealth.

The reports notes that measuring the direct effect of parental property wealth on their children’s home ownership is difficult because the Bank of Mum and Dad actually pays out in other ways when it comes to children’s living standards. As well as greater home ownership, young people with high levels of parental wealth are 74 per cent more likely to have a degree than those without parental wealth, and typically earn over £500 more per month . Both of these factors increase your chances of home ownership.

However the report shows that, even after accounting for these education and pay benefits, access to the Bank of Mum and Dad is independently driving up young people’s home ownership. In fact, the report finds that parental wealth has now become such a significant driver of young people’s home ownership prospects that it is catching up in importance to more obvious drivers, such as how much young people earn.

House of the Rising Son (or Daughter) finds that a family moving from typical to high parental property wealth (at the 75th percentile) is associated with a 9 per cent increase in the probability that their children will become homeowners in a given year. This compares to a 15 per cent increase in the probability that someone becomes a homeowner if they have high, rather than typical, annual earnings.

The Foundation says that while it is natural for parents to want to help their children on to the housing ladder, it is not be the answer for all would be first time buyers, not least because half of millennials who do not own their own home do not have home-owning parents.

It adds that having a society where young people’s housing aspirations are so dependent on what their parents own is undesirable, and emphasises the need for politicians that say they want a socially mobile country to focus on wealth not just income.

While building more homes will help, the report notes that policy makers will need to be more radical if they want to see real change, with high house prices also being driven by long term declines in interest rates that are unlikely to be reversed anytime soon.

Stephen Clarke, Senior Economic Analyst at the Resolution Foundation, said:

“High house prices and sluggish wage growth have meant that being able to buy a home of their own is almost impossible for many young people without access to the Bank of Mum and Dad.

“In fact, our housing crisis is so big that what your parents own is becoming as important as how much you earn when it comes to owning your own home. This is particularly worrying for the one in two millennials who aren’t homeowners, and whose parents also aren’t either.

“These findings reinforce the need to think more broadly about what the barriers to social mobility are in 21st century Britain. We’ve always known that who your parents are affects what education you get and job you do. But increasingly the effect is continuing later into life by determining whether you are able to own a home of your own.”

The post Young people with property-owning parents are now almost three times as likely to have homes of their own appeared first on Resolution Foundation.

Home ownership is rising, but the crisis is far from over

$
0
0

Across the country today hundreds of thousands of twenty and thirtysomethings are heading back to their parents’ homes for Christmas. Most (around two-thirds) of these parents are home owners, but the same cannot be said for their kids.

Home ownership rates have fallen across all age groups in the UK in recent decades, with the most pronounced fall for young people. In the late 1980s half of young families (by which we mean a single adult or couple headed up by someone aged 25-34, along with any dependent children) owned their own home. By 2016 this share had collapsed to just one-in-four.

This – coupled with the high share of income that all families are now having to allocate to day-to-day spending on housing – is what a housing crisis looks like.

But the latest data brings news of Christmas cheer: it confirms that young families’ home ownership rates are continuing their first sustained rise in 30 years. Since 2016 they’ve risen from 25 per cent to 28 per cent. This increase, and the recent change for other age groups, is shown in Figure 1 below.

Tthis may be a small change when put in the context of the long-run decline. But it means that 190,000 more young families will have a home of their own this Christmas than would have done if the 25-34 year old home ownership rate had remained unchanged since early 2016. This is definitely welcome news.

Why has it happened? Three reasons stand out. First, credit conditions for first-time buyers have been improving. The median loan-to-value ratio on new mortgages for first time buyers was at 90 per cent throughout much of the 2000s, before plummeting to a post-crisis low of 75 per cent in 2009. Since then it’s been rising steadily, hitting 85 per cent in 2016 and remaining at or near this level for the past two years. Beyond the deposit barrier, a move from lenders towards offering longer mortgage terms may have helped those first time buyers for whom the monthly cost of maintaining a mortgage might have otherwise prevented the move into ownership.

Second, the period of rapid house price growth has come to an end over the past two years. Average house price growth peaked at 9.4 per cent in late 2014, and this had slowed to 3 per cent by mid-2018. At the same time the growth rate of nominal pay has been increasing, albeit very slowly. The UK’s Gladiator-style house price travellator is a bit more surmountable than it was just a few years ago.

Third, the introduction of the three per cent stamp duty surcharge on additional properties coupled with stamp duty relief for first-time buyers will have helped to rebalance housing demand towards young families. This is welcome and – as we outlined in our Intergenerational Commission – there’s certainly more that can be done to tilt the tax system further in this direction.

However, even though things have been on the up recently, we shouldn’t crack out the eggnog just yet. Not to turn into Scrooge, but here are four things to consider that might just temper our Christmas cheer.

First, the tick-up in home ownership hasn’t happened everywhere. As shown in Figure 2, in the North East, East of England and the East Midlands home ownership rates for young families have continued to fall (although at a slower rate than in the first half of the decade).[1]

Second, the fundamentals that led to low home ownership rates for young families are still very much with us. There’s no sign that historically low interest rates, which have supported high house price to income ratios, are going to become a thing of the past. For this reason, we shouldn’t be surprised if what’s actually happening here is not the start of a new normal of rising home ownership. Instead, it’s likely that the cohort for whom the crisis caused a delay in their ability to become owners (both because of falling living standards and tighter credit) are finally managing to surmount the deposit barrier.

Third, there’s still a long way to go. Even though the worst may be behind us it’s still the case that home ownership rates are still a long way shy of their peak for young people. The scale of lost ground is such that 1.4 million more young families would be home owners today if the share of this group in home ownership hadn’t fallen since the late 1980s peak.

Fourth, although young families’ ownership rate is at 28 per cent nationally, our new analysis of home ownership at small geographical areas reveals that in some parts of the country – particularly in cities – ownership rates are much lower than this.

Obviously, London stands out; just 17 per cent of young families are owners here compared to 28 per cent across the country as a whole. But, the capital isn’t as much of an outlier as you might think. Other large cities – many of the places where young people are keenest to live – such as Southampton, Birmingham, Liverpool and Manchester, have similarly low home ownership rates of between 16 and 19 per cent. Table 1 shows the areas with the highest and lowest home ownership rates outside London.

As can also be seen in Table 1, a wider mix of places have higher rates of home ownership for young families. These areas are a mix of low earning/higher affordability areas further from the South East and high earning/middling affordability areas (where average prices are at least a third lower than those in the capital) within commuting distance to London.

The flip-side of low home ownership rates is a higher incidence of private renting. At the national level, the share of young families living in the private rented sector (PRS) has increased from just 9 per cent in the late 1980s to 34 per cent today. The UK government’s policy response to this ballooning of the PRS still leaves a lot to be desired. Despite welcome moves to scrap letting fees and cap deposits, it’s still the case that renters get a raw deal in the UK. The millions of families renting in the PRS deserve longer tenancies and rental stability.

Beyond the high level changes, it’s also worth zooming in on the increase in sharing in the PRS. Twelve per cent of all young families are now sharing with others in the PRS, an increase from just three per cent in the late 1980s. This is most likely not in ‘Friends’ style palatial apartments – but in relatively small houses of multiple occupancy.

In Table 2 we set out the local area differences in the proportion of young people sharing in the PRS. In order to see a clear picture of the picture outside the capital (where, for example, half of young families living in Westminster and Wandsworth are sharing in the PRS) we also remove London’s boroughs from this table.

This analysis reveals that almost four-in-ten young families in Brighton and Hove live in shared accommodation in the PRS. Other southern cities dominate this list. In contrast, rates of sharing in the PRS are lower in rural areas as well as within Glasgow (a city with a large social rented sector) and Edinburgh (a city with a high share of non-sharing private renters).

Beyond the early Christmas present of rising home ownership rates for some young families, these local statistics also reveal that housing tenure varies enormously across the country. And it’s not just young families in London for whom owning is a real minority sport either – other cities and areas are also clearly facing the same home ownership crisis as the capital.

[1] Young families’ home ownership rates have risen fastest in Yorkshire and the Humber but we shouldn’t read too much into this – the rise here is more a product of a rebound from a larger than average recent fall than a sign that property ownership is surging in this part of the country.

The post Home ownership is rising, but the crisis is far from over appeared first on Resolution Foundation.

First rise in home ownership for young families for 30 years – but Generation Rent is here to stay

$
0
0

Fewer than one in five young families own in Manchester, Liverpool and Birmingham

Home ownership rates for families aged 25-34 are rising for the first time in 30 years, but high barriers to entry facing first-time buyers remain acute, according to new analysis published today (Saturday) by the Resolution Foundation.

The Foundation says that eased credit conditions, as we move further away from the financial crisis, and a slowdown in house price growth in recent years have improved the situation for young first-time buyers. As a result, home ownership rates among 25-34 year olds have risen by 3 per cent since they hit the rock bottom level of 25 per cent in 2016.

The analysis finds that this increase is the equivalent of an extra 190,000 young families owning a home this Christmas. However, young families’ home ownership rates are still barely half as high as their late 1980s peak, when half owned their own home. If ownership rates hadn’t fallen sharply from this peak, 1.4 million more young families would be home owners today.

The Foundation adds that, despite this recent uptick, renting will continue to be the norm for the majority of young people, particularly in the UK’s major cities. The long term drivers of lower home ownership are here to stay with low interest rates and a shortage of homes driving higher house prices and deposit requirements. It would currently take a first time buyer in their late 20s around 18 years to save for a deposit if they relied solely on savings from their own disposable income, up from three years as recently as in the mid-90s.

New local area analysis shows that fewer than one in five young families in London, Manchester, Liverpool, Brighton and Birmingham currently own. For these families, owning their own home is likely to come far later in life, if at all.

In contrast, nearly half of young families in areas like South Lanarkshire, South Hampshire and Central Bedfordshire already own – highlighting that Britain’s housing divide is not just between London and everywhere else but between our major cities and rural areas.

The analysis shows that falling home ownership rates, and reduced access to social housing, have driven rapid growth in the number of young families who rent privately. Nationally, the share of young families in the private rental sector increased from just 9 per cent in the late-1980s to 34 per cent today.

For this group of renters, shared residencies are quickly becoming a core feature of urban British living: twelve per cent of all young families are now sharing with others in the private rental sector, an increase from just 3 per cent in the late 1980s. In Bristol and Brighton, one in three young private renters are now living in shared accommodation.

The Foundation says that rising home ownership rates for young people will be welcome news, but a better deal for renters is needed as the high financial barriers to getting on the property ladder will continue to force many into long-term renting.

It calls for the government to improve security and stability for young tenants by making indeterminate tenancies the sole form of private rental contract and introducing light-touch rent stabilisation that limits rent rises to CPI inflation for set three-year periods.

Daniel Tomlinson, Research and Policy Analyst at the Resolution Foundation, said:

“After decades of falling home ownership, recent conditions in the housing market as we move away from the immediate aftermath of the financial crisis are finally helping more young families to buy a home of their own.

“But the long term drivers of lower ownership rates, including low interest rates, and high house prices and deposit requirements, are here to stay. Home ownership rates for young families are barely half as high as they were back in the late 1980s, while fewer than one in five own in many of Britain’s major cities.

“So as well as welcoming the tick up in youth home ownership politicians should act to increase the number of homes available to buy, use the tax system to favour first time buyers over second home owners, and ensure that the private rental sector is fit for purpose – providing the security that many young families need.”

Notes:

Young families” refer to a single adult or couple headed up by someone aged 25-34, along with any dependent children.

The post First rise in home ownership for young families for 30 years – but Generation Rent is here to stay appeared first on Resolution Foundation.

Tightening up Britain’s wealth taxes and subsidies could raise almost £7bn

$
0
0

Tightening up five of Britain’s existing wealth taxes and subsidies could raise almost £7bn a year by 2022-23 – and provide a down payment on covering the £36bn a year increase in the cost of public services by 2030 – the Resolution Foundation says today (Thursday) in a new briefing note.

The Foundation says that while the first three months of this year will inevitably be dominated by Brexit, the last three months of 2019 are likely to be dominated by the Spending Review, as the Chancellor sets out his spending priorities for the remainder of the parliament.

One of the biggest challenges for this and future spending reviews, the Foundation says, is how to fund the rising cost of public service provision as the population ages.

It notes that this demographic headwind and rising health cost pressures are set to increase the cost of the current welfare state by £36bn a year by 2030, and by £83bn by 2040.  This figure for 2040 is equivalent to almost doubling the basic rate of income tax, from 20p to 39p, if funded entirely through income tax, rather than wealth taxes.

The briefing note says that with Britain’s record £13 trillion of wealth undertaxed relative to the size of its economy, a wider debate about the role of wealth taxes is needed. The Foundation says that there is a strong case for scrapping council tax and inheritance tax altogether, and replacing them with a genuine property tax and a Lifetime Receipts Tax.

However, the briefing shows how significant progress can be made even if the politics of Brexit and a governing party without a majority make wholesale reform of headline wealth taxes difficult. The Chancellor could raise almost £7bn a year by 2022-23, by making five tweaks to existing wealth taxes or subsidies ahead of his Spending Review:

  • Limiting entrepreneurs’ relief. New figures show that the cost of this policy is due to rise to £3.9bn in 2023-24, with three-quarters of the relief going to just 5,000 people. Returning the lifetime cap back to its previous level of £1m, rather than the current £10m, would raise £1.6bn a year.
  • Going Scottish on council tax. Council tax is Britain’s biggest, and arguably its worst, wealth tax. Replicating modest recent Scottish reforms – including increases in the top bands only – in England would raise £1.4bn a year. This could also be used to cut the tax for lower bands.
  • Clamping down on inheritance tax loopholes. Freezing the inheritance tax threshold after 2020 would raise £200m a year. Introducing a ‘farmer test’ and increasing minimum ownership periods for agricultural and business property reliefs, which together cost £1.2bn a year, would also help prevent super-rich individuals from using these reliefs to avoid paying inheritance tax and would raise £500m a year.
  • Making pension taxation more progressive. Making pensions tax relief slightly less skewed to the richest households by capping the tax-free lump sum at £40,000 would raise £2bn a year.
  • Scrapping Osborne’s ISAs. While the Foundation supports action to help young people afford their first home, there are far more effective policies than the Lifetime ISA and Help to Buy ISAs, which are poorly targeted and absurdly expensive. Scrapping them would raise £900m a year.

Torsten Bell, Director of the Resolution Foundation, said:

“Britain has unfortunately got used to weak income growth but soaring wealth, which is now worth seven times the size of our economy. It’s time our tax system caught up with that fact.

“Maintaining our valued public services in the face of the big cost pressures of an ageing population, requires better wealth taxation to help fund this gap.

“Yes this is politically difficult, but the good news is that relatively large sums can be raised simply by tightening up our existing wealth taxes and subsidies. That is how we protect our public services without placing all the burden of taxation on hard earned income from work.”

Adam Corlett, Senior Economic Analyst at the Resolution Foundation, said:

“Britain’s wealth is undertaxed, and the wealth taxes we do have are in serious need of reform.

“There’s a strong case for scrapping council tax and inheritance tax altogether, and replacing them with proper wealth taxes that are more progressive and harder to avoid.

“The Chancellor can make small steps in this direction by tightening up five of our existing wealth taxes and subsidies ­– raising almost £7bn in the process.

The post Tightening up Britain’s wealth taxes and subsidies could raise almost £7bn appeared first on Resolution Foundation.

Viewing all 60 articles
Browse latest View live


Latest Images